Part 1 of this article, which ran in the February 1999 issue of Sensors, addressed the physics of vibration; dynamics of a spring mass system; damping; displacement; velocity; acceleration; and the operating principles of the sensors that detect and measure these properties. The equations, figures, and references in Part 2 are numbered consecutively from Part 1.
A more detailed version of the material presented here is scheduled for publication by the Institute of Environmental Sciences and Technology (IEST) as reference work IEST-RP-DTE011, Transducer Selection [15]. The document may be purchased from the organization by contacting the Institute of Environmental Sciences and Technology, 940 E. Northwest Hwy., Mount Prospect, Illinois 60056, 847-255-1561, fax 847-255-1699, [email protected] or www.iest.org
The transducer (i.e., sensor, pickup, accelerometer) is probably the most important part of a vibration measurement system. Spurious, erroneous, or distorted output from the transducer is often difficult to detect, and may be impossible to correct. Furthermore, the transducer is usually located in the most hostile environment of any portion of the system and is therefore likely to generate erroneous signals.
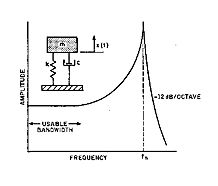 |
| Figure 9. The frequency response plot for a lightly damped spring mass system shows the sharp rise in response as excitation approaches the natural frequency. |
For discussion purposes, performance characteristics can be divided into two categories: dynamic and environmental.
Dynamic Characteristics
The primary performance characteristics affecting the shock or vibration measurement are sensitivity, dynamic range, and frequency response. These, along with mass, amplitude nonlinearity, and signal-to-noise ratio (SNR), are the fundamental parameters in the basic selection tradeoff. They are interrelated because accelerometers/force transducers use a single-degree-of-freedom spring mass system as the mechanical transducer mechanism.
Tradeoffs are inherent in the physics of seismic (mass-spring) sensors. Higher sensitivity is achieved by using a "softer" mass-spring system, generating greater strain and greater output at lower acceleration/force levels-but at the cost of having a lower resonance frequency. If the softer system is accomplished by increasing the mass, the transducer will be heavier. Higher sensitivity accelerometers/force transducers tend to become unacceptably nonlinear at higher levels of acceleration and/or force because of the higher stresses on the sensor.
Frequency response is typically flat within ±5% from some lower limit (determined by thermal transient response and amplifier characteristics) to ~1/5 of resonance frequency. Response is typically up by ~1 dB (12%) at 1/3 of the resonance frequency (see Figure 9). Higher sensitivity can also be achieved by amplifying the signal from a low-sensitivity sensor, but because the noise is also amplified, the SNR is not improved. Instruments designed to measure high-level acceleration/force have "stiffer" mass-spring systems and lower sensitivities; tend to be smaller; and have higher resonance frequencies. Instruments intended for high-frequency vibration measurements must have higher resonance frequencies, tend to have stiffer seismic systems with lower sensitivities, and are typically smaller and lighter weight.
Sensitivity/Signal-to-Noise Ratio. Higher sensitivity transducers are always desirable in that they maximize the SNR. These accelerometers, however, are generally larger, heavier, and characterized by lower resonance frequencies. In normal circumstances the sensitivity is not a critical problem because modern amplifiers are designed to operate effectively with low-level signals. Some integral electronics piezoelectric (IEPE) accelerometers with integral preamplifiers provide relatively high sensitivity with low mass by internally amplifying the low-level signal produced by their sensing elements, but they might not provide better SNRs because noise is amplified along with the signal. Limitations on the electronic performance of the amplifier may actually reduce the dynamic range. Consider as an example two accelerometers, one with 10 mV/g and the other with 100 mV/g. Both feature the same SNR (or noise floor figures in terms of equivalent g's). The higher sensitivity device offers no theoretical advantage over the lower one in terms of resolution.
In general, sensitivity should be as high as possible while still meeting requirements for usable dynamic range, frequency response, amplitude linearity, and weight. For general-purpose acceleration measurements, sensitivities of 10 pC/g or 10 mV/g are typical. This sensitivity is available in instruments weighing 0.5 oz. (14 grams) or less, with resonance frequencies of 30 kHz or more without excessive amplification. For force measurements, sensitivities of 10 pC/lbf or 10 mV/lbf are typical. Available in a variety of shapes and sizes, many of these devices are designed to fit onto electrodynamic shakers.
Dynamic Range. The dynamic range of most accelerometers/ force transducers is 80 dB or more, considerably greater than other instrumentation in the measurement chain. When you need to measure abnormally low or high acceleration/force levels, you must consider the range of the sensor. The 80 dB dynamic range must include the lowest and highest levels to be measured.
The lower limit may not be determined directly by the sensor, but from electrical noise from connecting cables and amplifiers. Some transducers, e.g., piezoresistive, IEPE, variable capacitance (VC), and servo, generate low-level noise internally, usually on the order of a few microvolts. Noise may be specified in terms of equivalent output units (e.g., g or lbf) or in electrical units. Manufacturers sometimes use the term resolution in their literature, and it should not be confused with noise floor or residual noise. There is no universal definition of resolution, so you should not make assumptions without additional information from the manufacturers.
Determination of the system noise level requires consideration of all the noise sources-transducer, cable, and amplifier(s). The system noise level, in equivalent output units, should be <1/5 the lowest vibration amplitude to be measured. However, when very low acceleration levels are of interest (e.g., at low frequencies), specially designed low-noise accelerometers and signal conditioners may be needed.
The upper measurement limit may be determined by the limits of the sensor's internal electronics or by the degree of nonlinearity that is tolerable. All accelerometers/force transducers become increasingly nonlinear as they approach the upper limits of their amplitude measurement range. Some (IEPE, piezoresistive, VC) maintain good linearity until they either clip the signal or break. Beyond their rated range, most piezoelectric sensors become progressively more
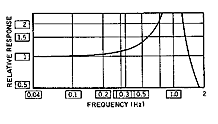 |
| Figure 10. The frequency response curve of an idealized accelerometer indicates ~1% sensitivity increase at 0.1 } natural frequency (fn), 5% increase at 0.2 fn, 12% at 0.3 fn, and 35% at 0.5 fn. |
nonlinear as the input level increases, until their nonlinearity error becomes intolerably large.
The upper limit of usable amplitude range should be at least twice the highest expected peak input amplitude to allow for unforeseen overrange inputs. Piezoelectric accelerometers can be selected for maximum tolerable nonlinearity at the highest expected peak input amplitude, if their environmental limit is twice that level and if a nonlinear overrange signal is acceptable. Signal conditioning should be chosen and/or ranged to prevent clipping or distortion at up to twice the highest expected input peak amplitude.
Amplitude-Frequency Response and Resonance. Amplitude-frequency response, commonly referred to as frequency response, should be flat (usually specified within ±5%) over the frequency range of interest. Undamped transducers meet this requirement for frequencies up to ~20% of their resonance frequency (see Figure 10). Additionally, to avoid excitation of its resonance, the transducer should have its resonance frequency at least 3 3 the highest vibration frequency present in the environment. This may be much higher than the frequency range of interest. It becomes particularly important in shock applications where the input spectrum can be extremely wide. A typical general-purpose accelerometer exhibits a resonance of 25 kHz to 35 kHz.
Accelerometers with higher resonance frequencies have stiffer sensing systems, and therefore lower sensitivities. Selecting an accelerometer with a sufficiently high resonance may therefore result in too low a sensitivity. In some applications, damped accelerometers or mechanical filters may be used to reduce the resonance response, permitting the use of an accelerometer with higher sensitivity and lower resonance. Accelerometers are available with integral mechanical filters, or a separate external mechanical isolator can be added. In either case, you must exercise great care to avoid undesirable effects of the mechanical filter.
Phase-Frequency Response. In single-degree-of-freedom responses, there is a time delay between the acceleration to be measured and the resultant output. This time delay is a function of the frequency content of the input and the damping of the transducer. (This discussion is limited to the transducer; it must be noted that signal conditioning adds its own phase and amplitude characteristics, particularly if filtering is included.) For sinusoidal input of a particular frequency, the time delay is a phase angle Φ, given by the following equation:

where Φ/2π = number of seconds output lags behind actual acceleration (if f is in Hz and is in radians)
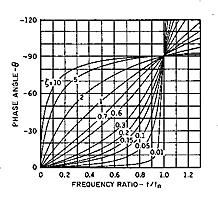 |
| Figure 11. Lightly damped accelerometers (0.01) have negligible phase shift at frequencies well below fn. |
The value of Φ approaches 01° at frequencies that are low compared to fn; is 90° at fn; and approaches 1801° at frequencies above fn for all values of damping. For underdamped systems, the values stay close to those extremes until quite close to the natural frequency, where the phase angle passes quickly through 90° (see Figure 11).
For 0° phase there is no delay, which is approximately the case of underdamped accelerometers. For optimally flat damping, where ζ = 0.7, it turns out that the phase is approximately linear, that is, the phase angle is proportional to frequency, which results in a constant time delay for any frequency. This is particularly important in the case of a complex input such as shock, which is made up of many frequencies. The shape of the waveform would not be maintained if the higher frequency components, for instance, were subject to more delay in the measurement than lower frequency components. In low-frequency measurements such as modal analysis, phase response can be very important. Piezoelectric and IEPE transducers, due to their AC-coupled nature, exhibit phase shift at the low end of the frequency spectrum. Piezoresistive, VC, and servo devices with DC response do not exhibit absolute phase shift or unit-to-unit phase differences at low frequency.
Amplitude Nonlinearity. Amplitude linearity of AC-coupled transducers, for instance, is typically characterized with shock techniques by the amplitude at which the sensitivity (based on peak comparisons) differs by a given amount from the sensitivity at low levels. For example,
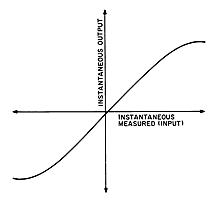 |
| Figure 12. The typical I/O curve shows increasing nonlinearity as input increases. |
an accelerometer may have sensitivity at 1000 g that is 1% higher than at 100 g. Sinusoidal testing to obtain amplitude linearity is yet another technique, often based on AC-rms measurements (based on the root-mean-squared value summing all frequencies except the DC component), which can obscure certain types of nonlinearity. Using this technique requires careful interpretation of results. A shift of bias due to vibration input, called vibration rectification, is a clue indicating the symmetry of the distortion, but the shape of the distortion is lost in the rms process. (For instance, a unit with nonlinearity that "flattens" the top of the sinusoid would experience a decrease in the bias measured during vibration.) Amplitude nonlinearity is usually specified as percent deviation at full scale, or X% deviation in sensitivity per Y measurement unit, i.e., 1% per 1000 g (see Figure 12).
Transverse Sensitivity. An accelerometer should respond only to accelerations along an ideal input reference axis defined by its geometry (usually the direction perpendicular to the mounting surface), and should have zero sensitivity in any directions transverse (orthogonal) to that ideal direction. A common imperfection in accelerometers is misalignment of the sensitive or input axis (the direction of acceleration causing maximum output) from the ideal (see Figure 13). This places a component of the sensitivity vector in a direction transverse to the ideal axis, giving the transducer transverse or cross-axis sensitivity.
Manufacturing tolerances and sensor element variations tilt the sensitive axis by an angle, θ, placing a component with magnitude equal to sinθ in the transverse plane. Alignment is critical; a misalignment as small as 1° creates a transverse component 1.74% of the magnitude of the sensitive axis.
Transverse outputs are maximum when the transverse input is aligned with the direction of the tilt. (Note that accelerations in the mounting plane along the line 90° from the tilt would result in no output.) Transverse sensitivity is
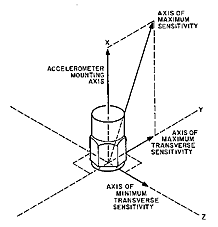 |
| Figure 13. Transverse sensitivity results from misalignment between the axis of maximum sensitivity and the mounting axis. |
the ratio of the maximum transverse output to the magnitude of transverse input, divided by the sensitivity in the ideal direction.
Most real environments exhibit motion made up of components in all three orthogonal directions (no matter what axes you choose). An accelerometer will therefore be subject to motions transverse to its sensitive axis as well as parallel to it. These transverse motions can cause two types of errors.
First, transverse sensitivity refers to the undesired output generated by excitation orthogonal to the sensitive axis. Transverse sensitivity is due to a slight misalignment of the axis of maximum sensitivity relative to the ideal orientation perpendicular to the mounting base. Most general-purpose accelerometers exhibit between 1% and 5% maximum transverse sensitivity at low frequencies, and the manufacturer's calibration data should include this measured value. For some accelerometers, the measured orientation of maximum and minimum transverse sensitivities is indicated to assist in minimizing the transverse sensitivity effect if the direction(s) of transverse vibration input are known.
Second, accelerometers will possess resonance(s) in the transverse direction that will increase their response to transverse vibration at higher frequencies. In some cases, the transverse resonance frequency is actually the limiting factor in the maximum usable frequency range of an accelerometer. Several accelerometer manufacturers specify these transverse resonance(s) with their calibration data.
Mass and Size. The mass of an accelerometer can significantly affect the dynamic characteristics of the structure to which it is mounted. This is commonly called mass loading error. The accepted practice is that the mass of the accelerometer should be <0.1 the dynamic mass of the structure. Because the latter is difficult to determine and changes with frequency, the typical practice is to use the lightest, smallest accelerometer that still satisfies sensitivity and frequency requirements [2].
The accelerometer's physical size can also affect the measurement. First, bolting the accelerometer to the structure may stiffen the structure; smaller instruments have less stiffening effect. Second, at high frequencies a large mounting surface will spatially average short wavelength motions of the surface on which it is mounted (as well as stiffen the surface of the structure). Third, smaller accelerometers are less likely to be affected by base strain inputs. General-purpose accelerometers typically weigh ~1 oz.
(28 grams), but microminiature designs are available with weight as low as 0.14 gram. Some very high sensitivity, very low frequency accelerometers may weigh several pounds.
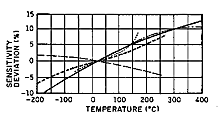 |
| Figure 14. Temperature sensitivity curves show variations in the temperature response of different crystal materials. |
Environmental Characteristics
Any transducer responds to its total environment, not just to the intended measurement parameter; the operating environment therefore can have a significant effect on measurement accuracy. Environmental inputs include temperature, thermal transients, base strain, electromagnetic field, acoustic, radiation, humidity, and electrical grounding. The American National Standards Institute (ANSI) and the Instrument Society of America (ISA) define standardized test procedures for most of the environmental effects discussed below. Unfortunately, many of the test methods described in these ANSI and ISA standards provide the user with only one point of reference under various environmental conditions that may cause the transducer to behave nonlinearly. It is nevertheless a good place to start.
Temperature. Because operating temperature affects sensitivity as well as the zero measurand output (ZMO) on DC-coupled transducers, the manufacturer's data should address this concern (see Figure 14). Instruments can be compensated to have a flat temperature response, or they can be calibrated at temperatures in the operating range. If the transducer has been calibrated at the operating temperature, and if that temperature is stable, the data can be corrected for the temperature error. If the operating temperature is not stable, then an instrument with flat temperature response should be selected. In some applications it may be practical to maintain the accelerometer's temperature at the level of calibration.
An accelerometer should never be used outside its specified temperature range or the result may be permanent degradation or total destruction of the instrument. The effect of temperature on the sensitivity of the transducer is called temperature sensitivity error or temperature response; some refer to it as temperature coefficients. Temperature responses of most piezoelectric/
IEPE transducers are not linear, even within their specified limits. Certain piezoresistive and VC sensors, on the other hand, exhibit fairly linear and repeatable temperature responses due to their simple mechanical designs and/or internal temperature compensation. Since most manufacturers do not supply individual temperature response information with their transducers, separate calibration should be requested if this characteristic is critical for the application.
Thermal Transient Sensitivity. Many accelerometers/force transducers-piezoelectric/IEPE in particular-produce an output when subjected to a rapid temperature change (see Figure 15). This thermal transient
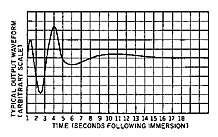 |
| Figure 15. A typical thermal transient response curve shows low-frequency variations in the output. |
response may be caused by sensing element characteristics, internal thermal gradients, or differential thermal expansion coefficients. This is normally a low-frequency phenomenon because of the thermal mass of the case and internal components and the length of the paths of thermal conductivity. There are three mechanisms that cause thermal transient outputs in piezoelectric devices; a transducer's output response is the result of any or all of them: Primary effect is the output caused by the pyroelectric nature of the piezoelectric materials. Most ferroelectric piezoelectric/ IEPE transducers exhibit the primary effect; quartz and tourmaline do not.
Secondary effect is caused by thermal deformation of the sensing element during the process of uniform heating. Strain buildup due to the crystal element's coefficient of thermal expansion produces an electrical output. All piezoelectric materials suffer from this effect.
Tertiary effect, inherent in all complicated transducer designs, is caused by the net strain buildup across sensor subassembly components (e.g., screw, electrodes, mass) due to thermal expansion. The amount varies, depending on individual mechanical design.
Piezoresistive, VC, and servo designs respond to thermal transients differently. Instead of producing an AC output, these DC devices may exhibit a change in ZMO due to thermal effects in their zero balance circuits. Commercially available accelerometers exhibit a wide range of thermal transient response. Some designs are so sensitive that normal air currents in a room can cause large outputs. These wide swings in thermal transient output can usually be avoided by providing a thermal shield or boot to insulate the accelerometer housing. Some especially sensitive accelerometers, designed for low-frequency measurements, are provided with protective boots. Other designs are inherently less susceptible to thermal transients and can be used without protective coverings. For measurements that do not require data below 5 Hz, amplifiers with high-pass filters are usually effective in filtering out the low-frequency thermal transient response. Extremely sensitive instruments or extreme environments (e.g., liquid nitrogen cooled chambers) may require protection even with a high-pass filter.
Base Strain Sensitivity. When the mounting surface is strained, some of the strain is transmitted into the accelerometer housing. If the structure of the accelerometer transmits a significant amount of strain to the sensing element, the element will generate a strain output in addition to the normal output caused by acceleration (see Figure 16). Strain output may be in phase or out of phase with the acceleration output. Since the strain is most likely caused by structural vibration, the strain output will often be at the same frequency as the acceleration output. Even very stiff structures exhibit high local strains at modal resonances. Because of the insidious and unpredictable nature of base strain, the data are impossible to correct. The recommended prevention is to use accelerometers with low base strain sensitivity. As common sense would suggest, adhesively mounted transducers exhibit less base strain sensitivity than stud-mounted types, and smaller transducers show less strain output than larger ones. Refer to the product data sheet for base strain sensitivity specifications.
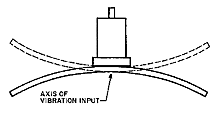 |
| Figure 16. Base strain output is caused by transmission of the strain in the mounting to the accelerometer's sensing element. |
Electromagnetic Sensitivity. Most accelerometers, if shielded and grounded in accordance with the manufacturer's instructions, will operate satisfactorily in normal environments. For use in high-intensity electromagnetic fields, however, special attention must be paid to the transducers' electromagnetic sensitivity. For instance, accelerometers are commonly used near or on big electrodynamic shakers. Shakers designed for the higher frequencies tend to have larger magnetic fields at the mounting surface, and the effect these fields have on accelerometer operation is influenced by sensor design. Some transducers (generally old piezoresistive units) include masses made of ferromagnetic materials in which magnetic forces can be induced. These forces have periodic components that are generated as the masses pass through gradients in the magnetic fields, and are therefore indistinguishable from the sinusoidal acceleration. The larger the gradient in the magnetic field, the larger the magnetic effects. Contact the manufacturer for information if the electromagnetic sensitivity specification is not specified on the product data sheet.
Acoustic Sensitivity. High-level acoustic noise impinging on the case of an accelerometer can cause it to generate an output similar to that of a microphone. Acoustic sensitivity has been found to correlate closely with case strain sensitivity. Although there are test procedures for acoustic noise sensitivity, they are difficult, time consuming, and expensive. Most manufacturers do not test their product designs for acoustic noise sensitivity because in most applications acoustic noise output is not a significant problem. In applications where the acoustic environment is >100 dB SPL (sound pressure level), the recommendation is to use instruments that have been tested and demonstrated to have low acoustic sensitivity. If these data are not available, use units with case strain sensitivity as low as possible. In applications 120 dB SPL, units tested for acoustic sensitivity should be used.
Radioactive Environments. The manufacturer should be consulted before using any accelerometer in a radioactive environment. Even at low levels of radioactivity, the useful life of a transducer with internal electronics can be significantly shortened. Operation at higher levels necessitates special attention to the materials of construction. In most cases, the specific model to be used must be tested and qualified for the environment. Specially designed piezoelectric and piezoresistive accelerometers have been shown to withstand up to 610 rad of integrated gamma flux.
Humidity. Moisture or high humidity can cause leakage paths across high-impedance elements in piezoelectric transducers. The resultant low resistances shorten the time constant of the affected circuits and degrade low-frequency response. Because their internal impedances are lower, piezoresistive and IEPE transducers are less seriously affected. The sensing elements of VC accelerometers are usually hermetically sealed, and other integral circuitry may be protected by conformal coating. General-purpose accelerometers are typically sealed but not truly hermetic; that is, they are sealed with epoxy or other elastomers, or O-rings, but are not fusion sealed. This treatment may be adequate for most normal environments, but true hermetic sealing may be required when the sensor is to be used in environments characterized by wide temperature and humidity excursions. This means welded metal-to-metal joints and fused glass-to-metal seals that exhibit leak rates <10-8 scc/s. High-output impedance piezoelectric transducers installed in severe environments may require protective coatings on the cable connections and cable jacket. Even in low-impedance output transducers such as piezoresistive or IEPE, moisture can create problems for the
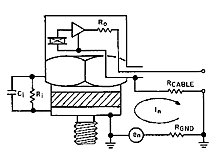 |
| Figure 17. Insulated accelerometer mounting, either internal or external, breaks the ground loop circuit. |
output signal. The most neglected aspect of sealing is probably the connector/cable assembly junction; the solution is to pot it with an appropriate sealing compound.
Grounding/Electrical Isolation. Good instrumentation practice dictates a single, known, reliable ground point to prevent ground loops in the signal circuit. Because the ground at the measurement point is usually unknown or unreliable, the transducer signal ground should be insulated from the mounting surface (see Figure 17). Most piezoresistive and VC accelerometers are electrically isolated from their cases; piezoelectric transducers may be either isolated or grounded. Provide external electrical isolation when you are using a nonisolated ("grounded") accelerometer. Experimental data indicate that the lowest piezoelectric transducer system noise can be realized with a nonisolated accelerometer mounted on an isolated mounting stud with the signal conditioning grounded [16].
Placebo/Noise Monitor Channel. The shock and vibration measurement community is showing a renewed interest in placebo/noise monitor channels [17,18]. This concept suggests that adding one or more "zero-output" transducers (e.g., an accelerometer that produces no output in the presence of acceleration) to the existing dynamic measurement channels during actual data collection, and studying the output signals, would yield very useful insight to what's going on with the transducers. A placebo/noise monitor transducer is theoretically identical to a live unit in every parameter except for mechanical sensitivities. In an ideal situation, the zero-output channel should register nothing, but in the presence of an environmental factor such as EMI or thermal inputs it should respond to the stimulus and register a corresponding output. Comparing output signals from the real and placebo transducers serves as a form of validity check for the measurement. Ask the sensor manufacturer about placebo/noise monitor units.
Part 3 of this article, which will appear in the April issue of Sensors, will explore accelerometer installation and recalibration, and examine some application details.
References
15. A. Chu. 1998. Measurement Transducer Selection, Institute of Environmental Sciences and Technology Recommended Practice IEST-RP-DTE011, Institute of Environmental Sciences and Technology, Mount Prospect, IL.
16. J. Wilson. "Noise Suppression and Prevention in Piezoelectric Transducer Systems," Endevco TP 270.
17. H. Himelblau and A. Piersol. 1994. Handbook for Dynamic Data Acquisition and Analysis, Institute of Environmental Sciences, IEST RP-DTE012.1.
18. Sandia National Laboratories Standard Environmental Test Methods. 1983. Sandia Report SC 4452E(M).