
As sensor and communications technology continues to develop, we can envision a very different Internet than the one we use today. Rather than sending messages and browsing Web pages, we may experience new interactions such as experience sharing and browsing reality.
Data mining, defined broadly as extracting useful information and insights from data, may be the untold half of the sensor networks story. Given the potentially huge amount of data streamed by live sensors, algorithms to fuse, interpret, augment, and present information will become an increasingly important part of networked sensor applications. In this article, we'll show examples of data integration, analysis, and visualization of sensor information.
Reality Mining
We call the data mining of sensor streams "reality mining" to emphasize the direct mining of insight from operations-relevant sensor data streams. Reality mining provides an insight infrastructure between detection and action, allowing businesses and other organizations to use sensor data in valuable ways. For example, adding sensors to stands of trees would allow experts in a wood products company to monitor tree growth for operational efficiency and yield. Combining these sensor data with models of tree growth and projections of product markets as the trees mature could let the company make resource allocation decisions today to maximize profits later.
At a low level, mining is necessary to manage the data load. Filtering, averaging, removing outliers, and other manipulation techniques let you create a composite view of physical phenomena by blending the readings from clusters of sensors. At a high level, decision-makers are less interested in sensor readings than they are in trying to answer management questions such as, "How should I reconfigure my process or allocate resources to respond to current conditions?" Just as data mining seeks to create useful information from structured business data, reality mining seeks to create usable insight from sensor data.
Sensor Information Systems
Taming the growing torrent of sensor data requires unified systems to facilitate information management, sharing, and analysis. Such Sensor Information Systems will integrate and abstract sensor information, creating application platforms. Just as creating a Web page no longer requires deep computer science skills, sensor application writers will no longer need the kind of engineering knowledge required today.
Our prototype of a Sensor Information System combines commercial off-the-shelf software with real-time sensors, custom web crawling agents, and data modeling. It combines geographic information systems (GIS) software, mission planning/terrain visualization systems, and sensor networks. Its data sources include live sensor data, publicly available Web information, and commercial financial data within a photo-realistic, 3D visualization of our office building and environs. The visualization environment (TerraExplorer Pro by Skyline Software Systems) seamlessly knits together satellite and aerial photography, digital elevation maps, 3D models, and data overlays. We'll discuss three of our demonstrations in detail to give you an idea of how this works.
The aerial photography surrounding our office model is 15 cm resolution and natural color. The high-resolution area is inset into a 1 m resolution area encompassing a large section of Palo Alto. These images are inset into 10 m resolution satellite images of the region, which are drawn on a 1 km resolution photograph of the planet. The software automatically manages the display of the different resolutions, enabling smooth flights between global and ground views. The intermediate resolutions ensure relatively smooth visual transitions as the user zooms into the high-resolution areas.
Because of the variety of sensors in our system, it is, by analogy, more like a photomontage than a photograph. In some areas perfectly fluid fits are lacking (e.g., Web cam images update only rectangular 2D areas within 3D rooms; color mismatches are sometimes visible between satellite photographs of different resolutions; and some sensor elements are more dynamic than others). Such montages may be likely in Sensor Information Systems because application designers will apportion sensor and network bandwidth according to their individual monitoring or analysis priorities.
Alerts and Context
Our first demo uses TinyOS-based Smart Dust sensors from Crossbow for exception-detection, such as fires, in remote areas. Wireless Smart Dust sensors simulate the monitoring of a grassy area near our lab in Palo Alto.
Brush fires are a constant and expensive threat in California during the summer months. The summer fires in 2003 consumed ~740,000 acres, destroyed 3400 homes, and killed 24 people. Today, fires are typically detected by hikers, routine inspection, passing motorists or pilots, or satellites. In each of these cases, considerable time may pass before the fire is detected, allowing it to grow in size and destructive power. The delay makes it more difficult to fight and increases the resulting damage.
Sensor networks can be placed in known vulnerable areas or can include a few GPS-enabled units. This identifies the location of the fire upon its detection. In the reality mining environment, an emergency planner knows not only the location but can browse the surrounding aerial and satellite imagery in 3D to determine how best to respond and route firefighting resources to the scene.
The 3D environment supports information hiding and revealing. Using low-altitude views (see Figure 1), the operator sees the terrain as a firefighter would, viewing the alarm in the context of its nearby vegetation, landscape slopes, trail quality, and other terrain properties.
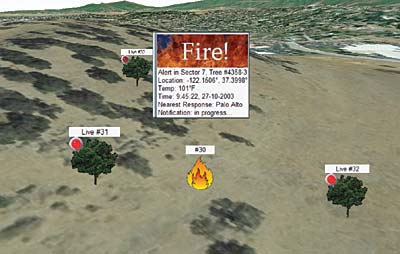 Figure 1. Live sensors show the temperatures of sensor-instrumented trees. Upon detection of a fire, an alert is displayed. The 3D environment provides high-fidelity contextualizing views, allowing more response planning to be performed before experts arrive on site. |
This information can aid in anticipating the initial spread of the fire as well as preparing the firefighters.
|
All of this planning can occur before anyone leaves a fire station and enters a dangerous, smoke-filled environment. The satellite photography provides a great deal of information that would otherwise be obtained from static maps or spotters at the scene with limited and singular views. The guiding principle: Bits are cheaper to send than experts.
As sensors become cheaper, it becomes possible to add them to areas that are currently too expensive to instrument. A qualitative change occurs, too, because we can add sensors to areas that may not have direct sensing value: The aerial and satellite photographs in our demo, for example, provide context to the live sensors. Similarly, Web cams and other sensors become more valuable as they provide context for sensors monitoring critical areas. These techniques also manage resources by reserving the highest resolution and bandwidth for the areas where it is most needed.
Instrumenting and Integrating
As sensors become inexpensive and easily deployed, individual measurements may become less significant than the sensor data relationships within the network. Sensors act as pixels, allowing us to construct views of the people, processes, and events we care about.
Our Sensor Information System presents a 3D model of our office and grounds, inset with Web cam streams that show live images of our research lab and presentation space. Logos and icons appear over the restaurants of California Avenue, a nearby commercial street in Palo Alto (see Figure 3).
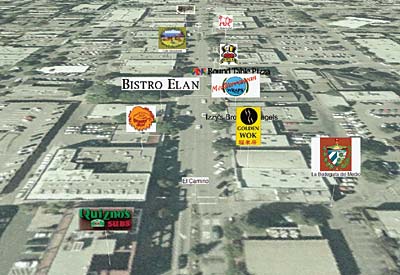 Figure 3. Virtual tourism or virtual shopping allows consumers to browse their local reality before leaving their homes. In this example, restaurant aerial views are augmented with their logos, which can be clicked to display live menus from the Web. |
The user can browse the restaurants by moving along the street. Clicking on a logo reveals the menu, which is retrieved live from the Web. Clicking on graphics above the train station reveals the current train schedule Web page. The demo can plot the breadcrumb trail of a Wherify sensor bracelet (see www.wherify .com for more information), locating timestamps on the aerial photographs to illustrate tracking applications. A software agent retrieves a current calendar of entertainment, sports, exhibits, and other events published online and plots times and descriptions at the venue locations.
With additional links and sensors, our California Avenue demo could be expanded into an extensive consumer browsing experience. Before they leave home, shoppers could check for local traffic conditions, parking availability, and size of checkout lines and shopping crowds. As additional sensors and Web services become available, we envision scenarios in which users can check if rental movies, dry cleaning, or theater seats are available before leaving the house.
These scenarios illustrate what we call "browsing reality." Ubiquitous sensor networks and business Web services provide users with high-fidelity views of their physical, social, and commercial worlds. Browsing reality will enable businesses to explore their supply chains, economic climates, and competitive environments. While today's Internet users browse the Web, tomorrow's will browse reality, exploring their offices, business assets, facilities, communities, recreation areas, entertainment facilities, and shopping districts.
Analysis and Visualization
The first two demonstrations in our Sensor Information System illustrate putting sensor alerts in context and integrating sensor data into a dynamic, near-real-time digital copy of the world. The third demonstration illustrates direct mining of sensor data, creating augmented displays of process-related reality for decision makers.
The Economic Weather Map (see Figure 4) is a visualization of the stock market performance of the 200 largest publicly traded employers in the San Francisco Bay area.
  Figure 4. The integrated Sensor Information System displays live and augmented sensor information. The Web cam image of the lab window streams live images, while the continuously updating Economic Weather Map appears cloudlike overhead. |
The stock price percentage changes are mapped to the office locations of the companies. The system then calculates a weighted average for each zip code. The contribution of each office location is weighted by the number of employees at the office. In all, about 460,000 employees are represented in the model. Positive change is indicated by green; negative changes are red.
The result is a live view of local company performance and a consumer sentiment map of Silicon Valley. The zip code regions are drawn, cloud-like, over the Bay area, augmenting the satellite and aerial photographs with business information. Using the map, retailers or restaurant owners with locations throughout the area can respond more precisely to changing conditions. In areas with strong positive sentiment, they may add temporary resources to meet the demand. In areas with weak or negative sentiment, resources may be pulled and used elsewhere or additional sales incentives may be offered.
The Economic Weather Map is an example of the kinds of augmentations possible with business or process data. As in traditional GIS, consumer-products retailers could overlay demographics and historical traffic patterns as they look for optimal store locations. In the Sensor Information Systems paradigm, many of the augmentations would be based on live sensors. For example, live and historical temperature, humidity, and wind information would help insurance companies perform more accurate risk assessment when underwriting properties near potential fire zones.
Conclusion
Ubiquitous networked sensors have the potential to generate vast streams of data; managing that much data represents a considerable challenge. The fire-response demonstration described earlier illustrates the simplest approach: Notice only exceptions and discard all other readings. A low-level layer of data mining can abstract sensor data into beliefs about the world, for example, taking several sensor readings and drawing from them a single conclusion about the correct temperature. But users of sensor applications are ultimately interested in solving problems. For them, reality mining isn't just about providing alerts or conclusions about the world; it's also about insights and decision-supporting views of their tasks and responsibility areas.
The emergence of sensor networks offers new opportunities for large organizations to develop high-fidelity views of their customer, supply-chain, economic, and competitive landscapes. Data mining of sensor streams, including Internet and internal data sources, creates additional insights and visualizations to augment these rich sensor-based views.
While today's practitioners think about remote sensing and real-time operating systems, tomorrow's integrated reality online will support remote expertise, real-time teams, and insight-based feedback to decision-makers. Beyond a view of real-time supply chains, sensors and the sensor information systems built upon their data will create an Internet we use to share experiences and browse reality. How will you know when this future has arrived? When you can TiVo your boss's vacation and skip to the exciting parts.