
A recent three-volume market study by Venture Development Corp. assessing North American markets for linear displacement, proximity, and rotary (nonmodular) position sensors forecasts market growth for the many different sensing technologies (Figure 1).
Figure 1. Types of position sensors studied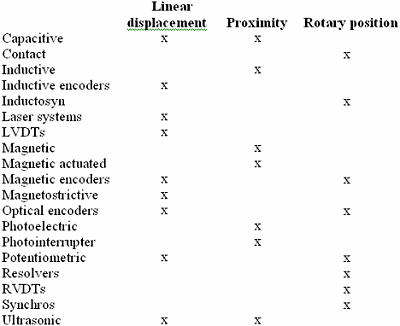 |
Among the sensing devices, the largest market is for proximity sensors, with the smallest market for linear displacement types (Figure 2). However, the highest growth rate is forecast for linear displacement sensors.
Figure 2. North American position sensor markets in millions of dollars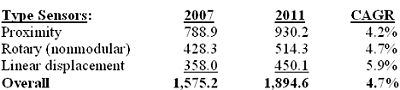 |
Growth Rate Variations
Market growth rate expectations for individual types of sensors are expected to vary widely during the period ending in 2011 (Figure 3).
Figure 3. Forecast North American market growth rates for position sensor types (CAGRs for 2007 thru 2011) 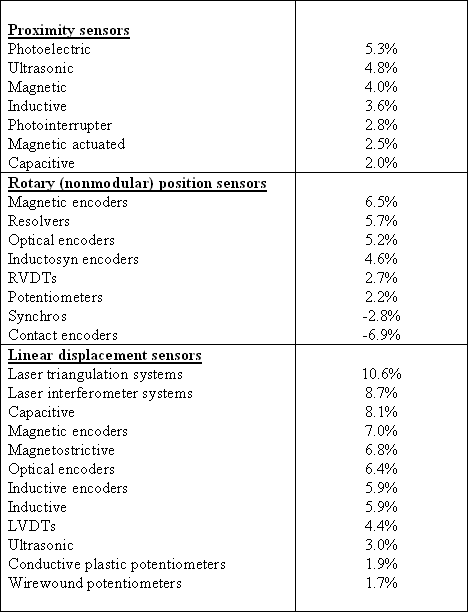 |
Proximity sensors. The highest growth rate of 5.3% per year is forecast for photoelectric sensors, with the slowest for capacitive devices at 2.0%. The fastest growing application market for photoelectric sensors is expected to be material handling, with 6.9% growth rate. Capacitive sensors are expected to experience the fastest growth rate with a forecast of 5.9% for assembly/robotics and lumber industry applications, respectively.
Rotary (nonmodular) position sensors. The highest growth rate is forecast for magnetic encoders at 6.5% per year, with expected double-digit growth of 12.2% in the food and beverage industry. The overall market for contact encoders may decline 6.9% per year, with the sharpest decrease expected to be in the electronics and semiconductor industries. However, the markets for these devices in metals, metalworking (machine tool), and medical equipment applications are expected to hold steady.
Linear displacement sensors. The fastest growth rate is forecast for laser-triangulation systems at 10.6% per year, with a 12.3% growth rate projected in the plastics and rubber industry. The slowest growth rate of 1.7% per year is forecast for wirewound potentiometric sensors.
High Dollar Volume Growth Markets
Should vendors shift their focus to high growth rate product market segments? Many of the highest growth rate segments represent relatively small markets and will not contribute much to market growth over the next few years. Large vendors may find it necessary to focus instead on market segments expected to achieve relatively high dollar volume growth, as opposed to those with the highest growth rates, to achieve acceptable and sustained sales growth.
In contrast, smaller market segments expected to achieve relatively high growth rates, but not necessarily high dollar volume growth, may have more appeal for smaller vendors. These specialized markets also are less likely to have established larger competitors and may be less appealing for large-vendor concentration.
Proximity sensors. The photoelectric and inductive product market segments are expected to contribute most significantly to North American market growth through 2011. Together these two product markets are expected to account for more than 89% of the $141.3 million North American market gain between 2007 and 2011. Photoelectric sensor material-handling applications are expected to account for the largest market growth. For inductive sensors, use on military/aerospace equipment is expected to account for the largest market growth.
Rotary (nonmodular) position sensors. The optical rotary encoder and magnetic rotary encoder product markets are expected to account for more than 81% of the $86 million North American market gain between 2007 and 2011. For optical rotary encoders, use on military/aerospace equipment is expected to account for the largest market growth. For magnetic rotary encoders, vehicle applications should be the largest contributors to market growth.
Linear displacement sensors. The optical linear encoder and LVDT product markets are expected to account for more than 46% of the $92.1 million North American market gain between 2007 and 2011. For optical linear encoders, use on metal processing and metal working (machine tools) equipment is expected to account for the largest market growth. For LVDTs, military/aerospace applications should be the largest contributors to market growth.
Market Growth
Several important factors are expected to determine growth in the position sensor markets, including:
Need for more and better automation. A major reason for growth in many product markets will be orders placed for new and expanding applications, along with conversion of older, manual, or less-sophisticated controls to state-of-the-art automation. The trend is toward more and better automated controls to improve performance and, in the case of industrial applications, to reduce costs, increase efficiency, and improve productivity.
Aiding this trend is the addition of desired features, such as advanced diagnostic capabilities, making the sensors more attractive to users. Also aiding market growth is the increasing number of sensors per piece of equipment. For example, the number of sensors per piece of robotic assembly equipment in the automotive industry is increasing as the equipment becomes more complex. Likewise, the number of position sensors on automotive vehicles is increasing.
Growth in applications and industries. The most significant reasons for the different growth rates among the product categories are the extent of usage of the sensors in different applications and industries and growth expectations. In addition, in many applications, there is competition among the different technologies, with displacements occurring.
Shifting manufacturing locations. North American manufacturers who purchase position sensors for their operations and/or the products or equipment they produce face strong competition from those with manufacturing operations in lower labor-cost regions of the world. To counter this trend, some manufacturers will shift all or part of their operations to these offshore facilities, which will have an adverse effect on the North American sensor market. Other U.S. and Canadian manufacturers will increase automation in their existing plants, and this will have a positive effect on the market.
Price trends. Average selling prices among the different types of position sensors are expected to change between –2.4% and 1.0% annually over the forecast period. Several factors that drive either price increases or decreases include:
- Advances in electronic technology. Improvements in microprocessors, chips, and other electronic components are ongoing and typically result in greater functionality, smaller form factors, and lower costs. These advances will drive down sensor prices.
- Competition. In some market segments, vendors will not enter into strong price competition because it will erode margins across the board.
- Economies of scale. Increasing shipment levels will lead to material and component purchases at better prices and greater efficiency and productivity of operations. This will reduce sensor prices.
- Features and performance. Important factors in choosing position sensor suppliers include reliability, performance, delivery, service, and availability of new products. These can command premium prices. Vendors who sell high-end products with advanced technology are better able to maintain prices. Often, new products are introduced for new applications at elevated price levels that later decline.
- Impact of offshore manufacturing. The advantages of manufacturing in low-labor-cost regions, such as China, apply equally to producers and customers. Sensor manufacturers continue to shift operations to these regions, and local firms in the regions export low-priced sensors to North America. When one supplier offers low prices, others may be forced to follow suit. Growing imports from regions having low-cost manufacturing add to price competition.
- Material and energy costs. These expenses force some vendors to increase prices, while others maintain price levels they might otherwise reduce. Most significant are increases in the price of copper, other metals, and petroleum fuels.
- OEM pressures. North American OEMs faced with strong price competition are seeking lower-priced components for their products and are putting more pressure on their suppliers to reduce prices. In some cases, they are consolidating orders, placing fewer but larger buys, and making stronger price-competitive awards. In addition, they are looking for potential suppliers with low prices. This pressure is particularly strong in the automotive and military/aerospace markets, where OEMs are continually pressuring vendors to reduce prices. Also, government contracts often contain provisions for set price reductions. In addition, the shifting of military/aerospace procurements to commercial off-the-shelf products rather than more expensive military-specification sensors is ongoing.
- Trend to commodity products. For some applications, particularly where performance requirements are not demanding, the trend is toward greater use of standard rather than customized or semi-customized products. These are typically sold to multiple customers and can be produced in higher volumes at lower cost and sold at lower prices.