
Fifteen years ago, Princeton University Professor Kevin Lehmann pioneered a new technology: continuous-wave cavity ring-down spectroscopy (CW-CRDS). CW-CRDS operates under the basic principle that every molecule has its own optical fingerprint—each molecule absorbs light at certain wavelengths and at other wavelengths the same molecule absorbs no light at all. These optical fingerprints are widely accepted and used across the scientific community and are published in refereed sources such as the HITRAN database. Trace gas analyzer manufacturer MEECO, intrigued by the promise of the technology, partnered with Lehmann to put his discovery—providing that CW-CRDS could be performed with small, affordable communication-grade lasers—to practical use.
Gas Analysis with Laser Light
CW-CRDS is highly stable and selective, with no tendency to drift or to confuse one molecule for another, provides analysis times of a fraction of a second, and can detect in the parts per trillion (ppt) range with the correct hardware. Here's how it works.
The cavity referred to in the name is a stainless steel chamber with highly reflective (99.998% reflective) dielectrically coated fused silica mirrors at either end (Figure 1). The laser light enters through one mirror and a light detector sits beyond the second. First, we adjust the laser temperature to emit light at the appropriate wavelength for zero absorption (based on literature references and experimental verification testing). When the energy in our stainless steel cavity reaches a pre-set threshold, the laser is shut off. The resulting light pulse bounces back and forth between the mirrors, the optical losses of the cavity causing it to lose a small amount of light on each pass. In a fraction of a second, the light makes many passes between the mirrors—for an effective path length of up to 30 km—before it decays or "rings down." The analyzer measures the time required for the light to decay. This "ring-down time" will normally be on the order of 100 µs in inert gases. We call this Tau zero (τzero).
 Figure 1. A schematic of CW-CRDS. The graph shows how the light diminishes as the laser pulse within the cavity rings down (Click image for larger version) Figure 1. A schematic of CW-CRDS. The graph shows how the light diminishes as the laser pulse within the cavity rings down (Click image for larger version) |
Milliseconds later, the laser is tuned to the second wavelength, this one correlating to the absorption peak of the trace contaminant to be detected, and another ring-down occurs. Here, the combination of the optical loss of the cavity and the absorption of light by the contaminant causes more rapid energy loss and a decreased ring-down time. The higher the concentration of the contaminant, the shorter the ring-down time. We call this second ring-down time Tau measure (τmeasure).
The ring-down decay follows an exponential formula and since the laser is actually shut off during the decay, fluctuations in the intensity of the light source do not affect the measurement of the ring-down time. Under the Beer-Lambert law (Equation 1), the concentration of the contaminant in the sample gas is uniquely determined using the inverse of these two ring-down times.
| (1) |
where:
| A | = | single-pass absorbance of the sample |
| ν | = | laser measurement frequency |
| σ(ν) | = | molecular absorption cross-section at the laser measurement frequency, a measure of the probability of interaction between light photons of a given energy and the molecule |
| N | = | molecular number density (concentration) |
| d | = | cell length |
Equation 2 gives τzero, the ring-down time for the first measurement:
| (2) |
where:
| τzero | = | initial ring-down time |
| c | = | speed of light |
| R | = | mirror reflectivity |
Equation 3 gives τmeasure, the ring-down time for the second measurement:
| (3) |
Using Equations 1, 2, and 3 we can calculate the concentration using Equation 4:
| (4) |
For example, at one of the detecting laser frequencies used in our moisture analyzer models, if τzero = 86 µs and τmeasure= 28 µs, there is ~754 ppb of moisture in a nitrogen gas sample.
Absolute measurement is possible with CW-CRDS technology. The wavelength for the laser is guaranteed accurate by an automatic test against a reference cell linked to the laser. In addition, the high reflectivity of the mirrors ensures accuracy in the measurement even if they become modestly contaminated. On slightly contaminated mirrors, both τmeasure and τzero will be shorter, but the end result will be the same because the difference between the two will be unchanged. This is monitored through a tuning option included in the software.
Bringing it to Market
The longer MEECO worked with CW-CRDS, the more the company recognized the technology's promise for commercial use: CW-CRDS provides a nondestructive and continuous molecular count in milliseconds, and has the potential to measure with an extraordinary dynamic range in the near-IR, mid-IR, and UV, across a huge array of analyte molecules and challenging gaseous matrices, including corrosives, toxics, and hydrides. The freedom from calibration also improves uptime and reduces total cost of ownership.
After close to a decade of development, we debuted the world's first CW-CRDS product in early 2002, called the MTO-1000. The potential for wide use of CW-CRDS technology was immediately apparent—the first five customers comprised the Dutch national laboratory, a gas contractor serving AMD Dresden, and semiconductor fabs in Oregon, Singapore, and Suzhou, China.
A year later we introduced a more modular configuration, the LaserTrace, capable of measuring up to four species and four independent gas sample streams in a variety of configurations. The versatility of the technology then allowed us to scale down the analyzer to a significantly smaller physical size and cost, without risking a loss in accuracy. This product, HALO, was launched in early 2007. These advances were achieved while maintaining the accuracy, speed of response, and ease of use associated with the technology. In late 2007, further advances in components led to the HALO+, capable of measuring from the low ppt range up into the ppm range. Figure 2 shows how our CW-CRDS products have evolved over time.
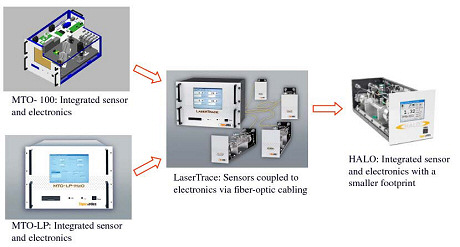 Figure 2. The evolution of CW-CRDS products (Click image for larger version) Figure 2. The evolution of CW-CRDS products (Click image for larger version) |
The practical applications of CW-CRDS analyzers continue to expand beyond their initial laboratory and semiconductor applications into process control, energy production, environmental monitoring, and pharmaceutical manufacturing. Future developments will lead to smaller packages, single-cavity multiple species measurements, and many other uses, for what was once considered only as esoteric spectroscopy.