

Thermistors
Thermistors are very accurate thermal transducers, indicating temperature through their resistance. Using them as a sensor, one measures the temperature by simply applying a voltage, measuring the current, and translating the resistance into a temperature. However, thermistors can also act as variable resistors in a circuit, affecting behavior through increases or decreases in resistance, depending on whether the temperature coefficient is positive or negative.
The response to temperature changes take time, and the principal parameter measuring this response is the thermal time constant (TTC). The materials and assembly of a thermistor have a critical impact on the TTC, so a team of engineers at Ametherm ran a number of experiments to show just how much the TTC can vary. Used in an application, we will then see just what kind of impact the TTC can have.
Construction Impacts the TTC
A thermistor consists of a resistive element that absorbs heat as it changes temperature. The response time is due to both the specific heat of the mass and the thermal conductivity of the mass and anything surrounding the mass. Commonly made of sintered ceramics, the masses or the element can also be made of silicon.
The TTC is an intrinsic device property that is independent of the rate of ambient change. When measuring the TTC, you need to apply a temperature change, but if that change is too slow then you're measuring the rate of change of ambient temperature, not the transducer's response. So it's important to use a temperature change that's as close to instantaneous as possible.
The response rate changes throughout the response, slowing down quasi-asymptotically as the device approaches steady state at a new temperature. Waiting until true steady state has been achieved would make for a difficult measurement to standardize, so the TTC is instead defined as the time it takes for the temperature to reach 1/e, or just over 63% of the full transition (see figure 1).
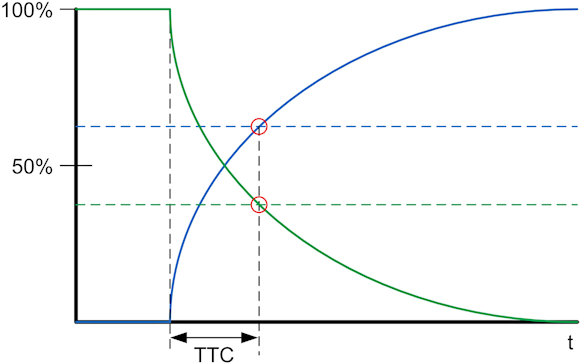
Fig. 1: The TTC measures response at 63.2% of the transition. The blue curve shows a cold-to-hot transition, and the green curve shows a hot-to-cold transition.
There are several variables that affect the TTC:
- The mass of the thermistor
- The shape of the thermistor (surface area vs. volume)
- The potting material used for encapsulation
- The external housing that encloses the thermistor
- The nature of the "ambient" – the gas or liquid in which the thermistor operates
- The methodology used to measure the TTC
If we were comparing different thermistor materials, then the specific heat of the material as well as the temperature coefficient – positive or negative – would also have an impact. These were not considered since all measured devices were of sintered transition metal oxide (NTC material). Sintering affects the resistivity and slope of the resistance temperature curves as well as the stability by closing the pores between different oxide particles.
Because the measurement method matters, it's extremely important, when comparing TTCs of different thermistors, to be sure that they're using the same measurement technique. TTC is expressed as an absolute time. So, for instance, if one device was measured with a 0°C to 100°C temperature change, while the other experiences only half that change, then the first device – even if identical to the second – will have a shorter measured TTC, since the TTC is driven by the temperature difference.
The two major variables Ametherm investigated were chip size, which affects both mass and shape, and encapsulation type. The first varies with the transducer itself; the second varies with the materials around the transducer.
Next page
Measurement Setup Affects TTC
The team carefully controlled the measurement technique to ensure that differences in measured TTC would truly reflect thermistor differences, without contaminating the measurement with test method variations. Considerations include:
- The ambient(s) within which the measurement is taken
- The flow of gas or liquid in the ambient, which will impact the measurement by directing heat towards or away from the device under test
- How the temperature is changed: Changing the temperature of a single ambient would take too long, artificially lengthening the measured TTC. To simulate as close to an instantaneous change as possible, it's more effective to have two media at two different temperatures, and then plunge the thermistor from one into the other. The slight difference in time between when the leading and trailing edges of the thermistor contact the new medium will generally be inconsequential as compared to the value of the TTC (milliseconds vs. seconds)
- Sensor "loading" – that is, the current it's carrying
The setup used by the Ametherm team consisted of what's referred to as a guillotine tester. It acts as a support (resembling a guillotine) that holds the thermistor in the air. The air becomes the first medium carrying the starting temperature. Connections are available to load the thermistor, and, as the test commences, the thermistor is released into liquid (in this case, mineral oil) at a controlled temperature different from the air temperature.
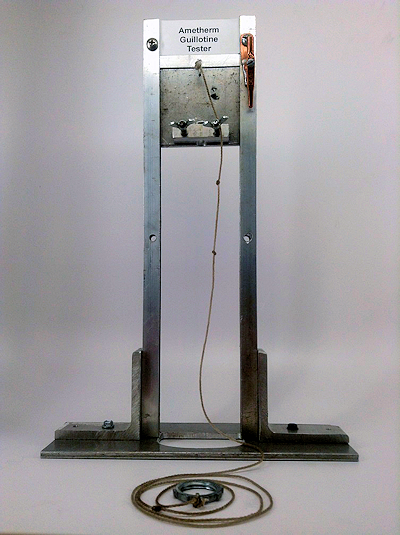
Fig. 2: Guillotine setup used for testing the TTC. The test medium would be placed below this, and is not shown.
Before being released, the thermistor must come to steady state within the air. The soaking time must account for the self-heating that will be caused by the loading current. So the protocol is:
- Let both ambient come to steady state; load the device so that it comes to steady state at the same time
- Once steady state has been achieved, the measurement begins
- The device is released into the test medium
- The response is measured as the temperature changes
Next page
Measurement Results
The team first compared two thermistors having very different chip sizes; one was ten times the mass of the other. The test plunged the thermistor from air at 25°C into mineral oil at 0°C. The results are shown in the following table.
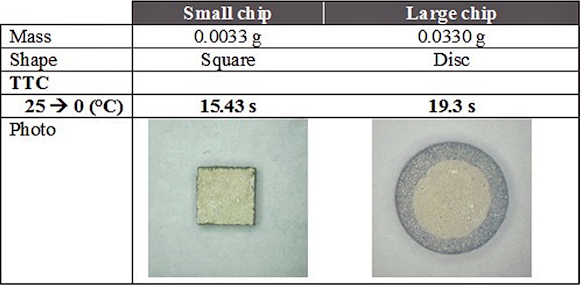
As expected, the larger mass takes longer to cool, resulting in a longer TTC. The transitions are shown in figure 3 below.
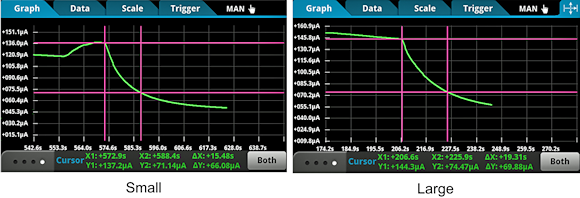
Fig. 3: The left graph is the response of the small thermistor; the right graph is the response of the large thermistor.
Next page
Next, two different types of encapsulation were tested using thermistors of almost identical mass, one encapsulated in glass, the other in black epoxy. Two tests were performed to indicate cooling and heating, with ending temperatures at 9°C and 41°C, respectively. The results are shown in the following table.
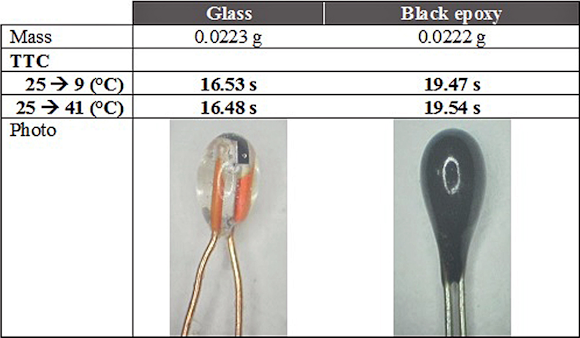
The results would indicate that glass is a better thermal conductor than epoxy. Photos of the response are shown in figure 4 below.
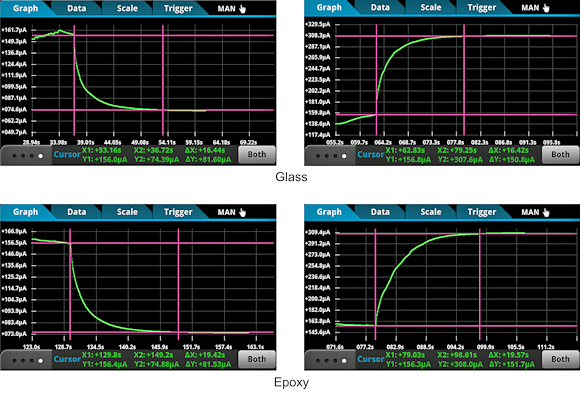
Fig. 4: Hot-to-cold and cold-to-hot responses of glass encapsulate (top) and epoxy encapsulate (bottom).
These tests reinforce that, when selecting a device for a given TTC, both the construction and the test methodology must be taken into account to ensure that there are no surprises later.
Next page
Why the TTC Matters
To demonstrate why this metric is important, the team put together a fire detection circuit as an example design. The critical question here is, when it gets hot, how long does it take for the thermistor to decide that there's a problem and raise the alarm? That delay is a direct function of the TTC (see figure 5).
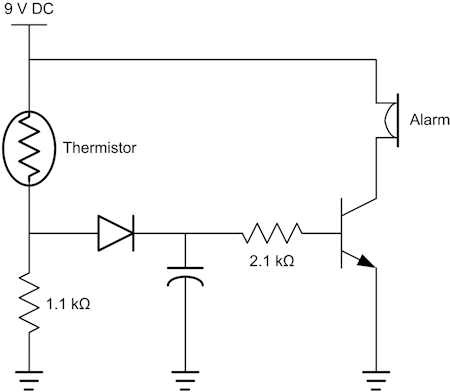
Fig. 5: Schematic of a fire alarm circuit that uses a thermistor to sense the temperature. If the resistance drops (negative coefficient) when the temperature rises, then the voltage divider point moves up. At roughly 1.4 V, the transistor will turn on, sounding the alarm. The TTC determines how long it takes for the circuit to respond. A practical implementation would likely need a way to silence the alarm while heat was still present.
The thermistor's role in this circuit is as the upper resistor in a voltage divider. In this case, you'd want to use a device with a negative temperature coefficient – one whose resistance decreases as temperature increases. As that upper resistance decreases, the divided voltage rises, eventually turning on the alarm through the transistor.
In an application like this, one would select a thermistor with a low TTC. When there's a rapidly escalating fire, seconds matter; using the wrong thermistor could place lives or property in danger.
Choosing the Right Thermal Time Constant for the Job
In summary, the TTC is a fundamental characteristic of a thermistor, and it must be selected per the application. How the thermistor is built, i.e., materials, size, and construction, etc., has a significant impact on the TTC. How the TTC is measured also affects the measured TTC value.
When selecting a thermistor, it's important to know what response is required and select a thermistor accordingly. When comparing the TTC between thermistors, it's also important to make sure they're measured under the same conditions.
As sensors proliferate, thermistors will find themselves in new and innovative applications. Choosing the thermistor with the right properties will help to avoid redesign work later on.
About the Author
Mehdi Samii currently serves as the vice president of engineering at Ametherm. He holds a B.S. in physics.
Related Stories
Thermistors As Accurate Temperature Sensors Part 1: Introduction and Methods
Thermistors As Accurate Temperature Sensors Part 2: Application and Results