
True position measurement answers the question, "Where is the target?" rather than "Is it present or not?" Devices used to measure a target's true position, whether contact or noncontact, provide a continuously varying response (analog voltage or current, or digital signal) that is proportional to target position, anywhere within the calibrated measuring range of the device.
For optimum performance, a position sensor must maximize system sensitivity to target movement and minimize sensitivity to all other effects and variables. Devices based on electromagnetic induction, including variable impedance, variable reluctance, inductive, and eddy current sensors, are good at these tasks. They are also inherently immune to noise and capable of performing fast, accurate measurements in inhospitable environments.
|
The Eddy Current Sensor
Precision eddy current noncontact measuring systems have been used for more than 30 years for displacement, vibration, thickness, alignment, dimensioning, and parts sorting applications. All these can be classified as variations on displacement because in each case the parameter being measured is the distance from the target to the sensor. The differences lie in the interpretation and implementation of the displacement data.
If a nonmagnetic conductive target material is introduced into the coil field, eddy currents are induced in the target's surface. These currents generate a secondary magnetic field, inducing a secondary voltage in the sensor coil. The result is a decrease in the coil's inductive reactance (the coil-target interaction is similar to the field interaction between the windings of a transformer). Eddy current sensors work most efficiently at high-oscillation frequencies. This type of system is also known as variable impedance because of the significance of the impedance variations in defining its complex nature.
Ferromagnetic target materials can also effectively decrease the coil's inductive reactance if there is sufficient eddy current flow to counteract the increased field strength resulting from the higher target permeability (µ >1). For high-precision measurements, however, we recommend the use of nonmagnetic conductive target materials for reasons discussed later.
|

Eddy current transducer performance is dependent on the impedance coupling between the electromagnetic field in the sensor coil and the eddy currents in the conductive target (see Figure 1). This coupling in turn depends on the inductive and resistive components of the mutual inductance between the coil and the target material. Sensor performance can be quantified by determining the "effective impedance" of the sensor coil as the distance to the target changes. Effective impedance is a complex function dependent on sensor coil characteristics, operating frequency, and target-coil impedance coupling characteristics. Based on these parameters, Zeff, the effective coil impedance, can be defined as:
| (1) |
where:
The effective impedance depends on the complex interaction among several variables, and has historically been determined empirically. However, recent advances in computer modeling provide a more efficient way to handle the design issues and thus shorten the product development cycle time.
Eddy current sensor performance is related to the change in sensor coil impedance over the calibrated range of target motion: high impedance change per unit of displacement near the target, and low change per unit of displacement farthest from the target. Sensitivity approximates an exponential function and has a well-defined finite value at zero displacement. Due to the inherent nonlinear characteristic of the basic output signal, final measuring system performance depends heavily on the type of demodulation and linearization scheme used. These details are beyond the scope of this article. However, it is important to note that most inductive-based systems can be optimized for a given coil diameter to achieve either a large usable measuring range or a high basic resolution.
A significant characteristic in determining resolution performance is the signal-to-noise ratio (SNR). Of course, the resolution capability of the final measuring system is influenced by the electronics circuitry used. To achieve the optimum SNR, the sensor signal must be maximized by optimizing the sensor coil impedance change per unit of target displacement. This is typically accomplished by tuning the sensor-electronics combination for operation over a relatively small range of target motion. The largest impedance changes per unit of displacement occur within the first 1/3 or so of the standard measuring range. Figure 2 illustrates percent active coil impedance change (for a small coil diameter) vs. calibrated measuring range for various target materials.
|
Target Material
The electrical parameters of target material resistivity and permeability determine the performance capability of inductive measuring systems. Nonmagnetic conductive materials (e.g., aluminum, copper, brass, gold), with low resistivity and a magnetic permeability of 1, can provide high output sensitivity in terms of impedance change per unit of target displacement. One excellent target is aluminum, at least 0.012 in. thick and with a diameter 2.53 times the sensor diameter. Smaller diameters can be accommodated with special implementation considerations, including circuit tuning, calibration details, and installation and user application details. The circuit must be calibrated to accommodate the reduced signal from the sensor (due to a smaller target). Calibration details include the fact that the system must be calibrated with the exact target as in the actual application. Installation and user application details require that the target of use be the same as the target of calibration, and that no additional conductive target material be moving in the sensor's view. For high-precision measurements, we recommend a target thickness of at least 0.025 in.
Materials with high electrical resistivity or a permeability >1 are less efficient than aluminum because these characteristics hinder the generation of eddy currents (see Figure 3). The resulting reduction in system performance can to some extent be ameliorated by extra attention to coil design and electronics optimization, but not to the extent of equaling the performance achievable with an aluminum target.
|
Conductive magnetic materials (iron, most nickels, and certain other alloys) have a magnetic permeability >1. Attention to coil design, oscillator frequency selection, and circuit tuning can result in high measuring system sensitivity to target position. However, slight variations in target material composition will tend to increase variations in system repeatability and gain, temperature coefficient, and setup. In extremely high precision measurement applications, magnetic target materials can exhibit changes in permeability (hysteresis) over time. These changes will alter system performance over time. When a high degree of measurement precision is required, we therefore recommend the use of nonmagnetic conductive target materials (e.g., aluminum, copper).
The system should be calibrated against the target material used in the actual installation. Specific calibration parameters include duplication of target and installation geometry if they will influence the characteristics of the eddy current fields. Operation against targets with high permeability will typically result in a higher sensor temperature coefficient and increased possibility for system drift, which may turn out to be caused by changes in target material permeability over time.
In general, system performance is not affected by the target surface roughness or smoothness, within reasonable surface finishes up to 250 µin. (available from most standard machining processes), because the sensor "views" the average of the total target area. For precision measurement applications, a target surface finish of 32 µin. (or better) is recommended to achieve highly repeatable and thus highly accurate performance. It is also important to note that nonconductive intervening materials have no effect because they do not influence the electromagnetic fields. Oil, grease, dirt, water, and steam therefore generally do not present a problem.
Range and Offset
For typical industrial and commercial applications, an optimum value for the measuring range is ~30% of the coil diameter. For high-resolution, high-precision measurements, a range of 5% to 10% of the coil diameter is optimum. Where less resolution is required, a range of up to 50% of the coil diameter is possible. In all cases, an offset (minimum sensor-to-target distance) equal to 10% of the measuring range is usually acceptable.
Mounting and Fixturing
Mounting and fixturing are crucial to the application of any precision position measurement device. When precision eddy current devices are to be used, the measurement area must be stable and the sensor mount rigid, and it is advisable to fasten the sensor-to-electronics cabling in place. It often happens that a mounting scheme that seems rigid will transmit vibrations from a nearby source into the target and/or sensor mount and cause measurement error. The source of such vibrations can be motors, pumps, or fans, both in and outside of the application equipment.
A critical consideration, and one that is often overlooked, is that of fixture distortion due to thermal expansion, particularly nonuniform expansion caused by nonuniform temperature changes. Temperature variations can cause materials to change shape and size according to the material used, size of component, and temperature gradient. It must be emphasized that materials that appear rigid and stable are in fact rubbery and flexible when viewed in the high-precision world of microinch and sub-microinch measurements. Material characteristics to consider include coefficient of linear thermal expansion, coefficient of thermal conductivity, modulus of elasticity (stiffness), and specific stiffness (stiffness divided by material density). Preferred materials for high-precision measurement applications include aluminum and stainless steel.
The majority of sensor installation and fixture components are made of aluminum, stainless steel, or ceramics. Materials are often selected by focusing on a single property, a practice that is unwise and typically does not produce the best solution, and often results in expensive and time-consuming redesign. To avert these problems, all relevant material properties must be considered to optimize performance.
Aluminum is a good choice where temperature gradients or rapid thermal stabilization are a concern. Aluminum has a high coefficient of thermal expansion, but also high thermal conductivity, a combination resulting in low thermal distortion (see Table 1). Aluminum has a lower modulus of elasticity, and, due to its lower density, a slightly higher specific stiffness than stainless steel. Specific stiffness is important when vibration immunity (isolation) is a consideration. Components with a higher specific stiffness will provide better vibration isolation than those with a lower specific stiffness. Aluminum is lightweight, easily machined, and resistant to material creep.
| TABLE 1 Characteristics for Various Fixture Materials | |||
| Material Characteristics | 6061 Aluminum | Austenitic Steel | Machinable Glass Ceramic* |
| Coefficient of linear thermal expansion, | 13 | 9.6 | 5.2 |
| Coefficient of thermal conductivity, k (Btu/hr-ft-°F) | 104 | 9.4 | 11.68 |
| Thermal distortion - relative comparison, | 0.125 | 1.02 | .45 |
| Modulus of elasticity, E (x 106 psi) | 10 | 28 | 9.3 |
| Density, | 0.097 | 0.29 | 0.091 |
| Specific stiffness, E/ | 103 | 96 | 102 |
| * MACOR, Duramic Products, Inc., 426 Commercial Ave., Palisades Park, NJ 07650. Data referenced from Duramic Bulletin 502-PD1. Robert C. Weast and Melvin J. Astale, eds. 1981. CRC Handbook of Chemistry and Physics, 61st ed., CRC Press:F-80, D-187-188. | |||
Stainless steel's lower coefficient of thermal expansion and conductivity results in a relative thermal distortion characteristic eight times greater than that of aluminum. Stainless steel, however, has a specific stiffness approximately equivalent to aluminum's, so would be a good choice for laboratory environments where high levels of stability are required in a uniform temperature environment. Stainless steel is resistant to material creep and is denser and tougher than aluminum, making it more expensive to machine.
Ceramics offer advantages over metals in terms of thermal expansion and possibly thermal conduction. Certain ceramics also provide high levels of modulus of elasticity. Most ceramics are weak under tension, however, and are less satisfactory than metals for vibration isolation and suppression. Ceramic materials can provide benefits over metals when used for thermal isolation. Although machinable ceramics are available, machining the complex component shapes tends to be a costly exercise.
Evaluating the Technology
A cantilevered beam can be used to illustrate environmental effects on eddy current sensor performance, sources of error, resolution, and versatility. The demonstration hardware consists of a simple cantilever beam constructed of rectangular aluminum conduit that has been black-anodized (see Figure 4).
|
An eddy current sensor under the free end of the beam measures vertical deflection:
| (2) |
| (3) |
where:
The beam-to-sensor nominal distance is set at approximately midscale in the calibrated measuring range. For the test displacements, material stress will be well below the 0.1% offset yield point for very repeatable deflections. Errors are typically due to mechanical friction in the setup, weight placement, temperature, and vibrations transmitted into the system from the surroundings.
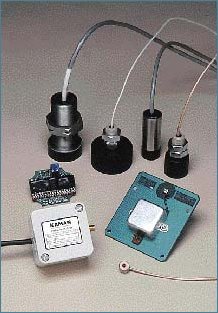
The Measuring System
The eddy current displacement measuring system used in this demonstration is Kaman's SMU-9000 incorporating a standard 5U eddy current sensor, selected for its high resolution, simplicity of operation, and robustness. The single-channel, analog-based SMU-9000 operates on 1215 VDC input (at 30 mA). Output is 0.09610.273 VDC with 15 VDC input.
The device includes only the basic circuitry: oscillator, signal demodulation, and zero and gain output stages. No linearization circuitry is incorporated because it would add unnecessary signal noise. The system achieves a nonlinearity of approximately ±1% F.S. over the calibrated measuring range. For the range of motion in this test, nonlinearity is 1020 times less.
The analog output voltage is input to a digital voltmeter that converts it to the RS-232 signal required by the laptop computer (see Figure 5).
|
The digitized signal is displayed by a strip-chart type program that provides signal scaling to engineering units (microns), and centering. No error correction is performed on the SMU signal, but the voltmeter and RS-232 do filter the signal, helping to reduce mechanical vibration noise in the system. The strip-chart program was selected because it provides easily interpreted historical trend data on beam deflection.
Calibration and Performance
Calibration. The SMU-9000-5U measuring system calibration specifications were:
- Target material: aluminum
- Measuring range ~100 microns (~0.004 in.)
- Offset ~355 microns (~0.014 in.)
- Output voltage range: 0.096-10.273 VDC
- Resulting average scale factor: ~102 mV/micron (2.54 V/mil)
All tests were conducted in standard room ambient laboratory conditions of temperature and humidity, with atmospheric pressure typical of 6800 ft altitude (at Colorado Springs, Colorado).
|
Precision and Accuracy. The SMU was tested at 11 points across its calibrated measuring range. Because limitations of the test equipment and the fixture made it impractical to carry out the experiment with the SMU installed in the beam demonstration hardware, the unit was removed from the beam and placed in a Doppler laser test bay enclosed on three sides, top, and bottom. The laser is a research-grade device with performance comparable to that of a laser interferometer. This device and the associated processes have an accuracy of ~4 µin., based on years of use in the test and calibration of precision eddy current measurement systems. The target was manually positioned and 10 measurement cycles were completed, beginning at the zero position and sweeping to the full scale position.
Figure 7 shows the data distribution curves and the standard deviation for the laser and the SMU at the full scale displacement position.
|
The horizontal axis is 50 nm (~2 µin.) per division. The SMU's bias (systematic) error from the laser reference is ~43 nm (~1.7 µin.). Using the standard deviation for the laser and calculating the 3-s regions yields ±0.069 micron (±2.7 µin.). Although this agrees closely with the ~4 µin. accuracy previously established for the laser, some error exists. The 3-s regions for the SMU are ±117 microns (~4.6 µin.).
There are several possible reasons for the error in this test:
- Open-loop operation of the laser, with human control on the positioning repeatability
- Drift of test setup and equipment drift over time; during the two or more hour duration of the tests, it is very difficult if not impossible to control fixturing to movements of less than a couple of microinches, and the test setup was not re-referenced during testing
- No calibration of the SMU coincident with taking these test data; it had been calibrated about two years previously, used in the interim, and reinstalled specifically for this test
- Fixture drift during testing; neither the laser nor the SMU was re-referenced
In an actual application, a calibration reference standard (or standards) could be used to remove the bias error from the system. This would align the SMU mean with that of the laser data. It can also be seen that system performance is only as accurate as the calibration and the reference standards used to perform it.
Supporting Evidence
With an understanding of the difficulties in achieving a high level of precision in position measurement, the reader will have a greater appreciation
|
of the extremely small deflections (tens of microns down to ~0.01m) measured in the following exercises. They are remarkable for several reasons. First, these displacements can be reproduced in an environment outside the laboratory. Second, the experiments demonstrate the extremely high resolution of the eddy current displacement measuring system. Measurement resolution and precision at the levels demonstrated are typically reserved for cleanroom environments implementing measurement equipment costing many thousands of dollars (such as laser interferometers) with the related (and expensive) equipment required to isolate the laser system from environmental effects.
Beam Deflection Due to Weights. Several weights are used: 1, 2, and 5 gram. For this demonstration, the strip-chart scale will be 10m peak-to-peak and 1 m/division. The data are shown in Figure 8.
Beam Deflection Due to Heat Transfer from a Quarter. A quarter that is warmer than the beam is placed on the top surface of the beam. Beam response (deflection vs. time) is an immediate deflection that decays over time. The immediate response results from thermal stresses caused by sudden localized heating from the quarter. The displacement decay over time is due to the beam and quarter's reaching thermal equilibrium with the surroundings (cooler than the initial temperature of the quarter). The time required for the displacement to decay is a minute or so. For this demonstration, the strip-chart scale will be 10m peak-to-peak and 1m/division. Beam deflection will be two to three divisions.
Beam Deflection Due to Light. Light from a standard D-cell flashlight is directed at the beam from a distance of several feet. This causes localized heating of the beam, resulting in thermal stresses (expansion) and deflection of the free end of the beam. For this demonstration the strip-chart scale will be 0.1m peak-to-peak, 0.01m (10 nm or 0.4 µin.) per division. Beam deflection is dependent on the time the light remains on the beam; a longer duration results in more deflection. Fractions of a second to a second will result in beam displacements of 20 to 30 nm (two to three divisions).
| Defining the Terminology |
| A measurement method consists of the procedure and/or instructions that can be followed to measure the properties of some physical material. A measurement process is the total of the particulars required to make and quantify the measurement data. These include the measurement method, resources, and equipment required; the material to be tested; and the details associated with statistical quality control, including a definition of the "system of causes" of error. The distinction must also be made between precision and accuracy. Precision refers to the agreement of independent measurements of a single quantity taken by repeated applications of the measurement process (rather than the measurement's agreement with the long-run average value, i.e., the statistical mean value of a set of data samples). Accuracy is the agreement of independent measurements with the target value of the quantity of interest. Accuracy thus signifies the closeness of the data to a specified target value; precision quantifies how closely the data points agree among themselves. |