In Part 1 of this two-part article we presented a simple voltage divider circuit using a thermistor that is used to provide temperature compensation to temperature-sensitive electronics such as those used in LASP's XRS electronics for the GOES-R environmental satellite. We explored a number of methods to achieve the best accuracy from the circuit. In Part 2 of the article we move on to assessing the circuit's performance and explore ways to boost the accuracy of the circuit even further.
A significant feature of merit for temperature measurements is the smallest change in temperature that the circuit can measure—its temperature resolution. We can calculate the temperature resolution of the circuit for an N-bit ADC by using Equation 14:
 |
(14) |
where:
| TRES | = | degrees per ADC count |
| TMAX | = | maximum temperature to be measured |
| TMIN | = | minimum temperature to be measured |
| N | = | number of bits of resolution for the ADC |
Note: The output voltage is assumed to be linear.
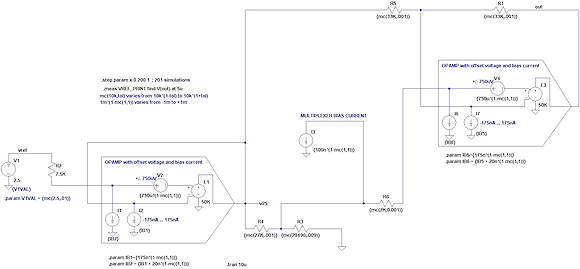
So, using a 12-bit ADC and a temperature range of ±32°C, TRES = 0.015625. This is slightly larger than the error of the SH-H estimate from the earlier results. To fully estimate the error bounds, we can make a model of the circuit in Figure 8, either mathematically by using Matlab as well as other programs, or using a tool such as LTSpice. Using either method, we can perform a Monte Carlo analysis to determine the standard deviation of the estimated temperature. Figure 8 shows the example circuit in LTSpice used to perform a Monte Carlo analysis. Op amp bias currents, offset currents, offset voltages, and resistor tolerances are all included. Using the model we achieve the 3σ error bounds in temperature estimates as shown in Figure 1 (see Part 1 of this article). The larger errors at the lowest temperatures are due to the modeled accuracy of the thermistor, which is worse at low temperatures.
 Figure 8. LTSpice circuit used to perform Monte Carlo analysis of the thermistor circuit (Click image for larger version) |
The Monte Carlo analysis error limits define the absolute error when estimating temperature using the techniques we have discussed. In estimating temperature over the range of temperatures shown in Figure 1, we expect the relative errors to be smaller than the absolute errors. That is, if the maximum absolute error between ±20°C were 0.2°C, the reported temperatures may be –20.2°C to 19.8°C, with a near constant offset of –0.2°C. The relative difference between any two temperatures reported would likely be much less than the absolute error. While we have not determined a method of estimating the relative error, actual circuit performance has shown this assumption to be true.
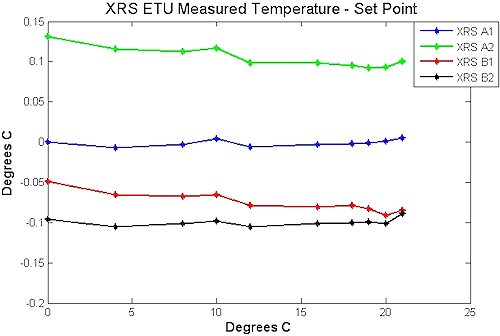
As an example, the XRS engineering test unit (ETU) electronics for GOES was temperature-controlled from 0°C to 21°C. The ADC resolution was 12 bits and the four thermistors on the board, referred to as A1, A2, B1, and B2, were all in close proximity. As a result, we expected the board temperature variation to be very small due to low power dissipation. A proportional-integral controlled chiller/heater system controlled the temperature, using thermistor A1 as the feedback in the control loop. When compared to the set-point temperature, errors in temperature A1 should be the smallest and this was indeed the case, as we see in Figure 9. We solved Equation 15 for each thermistor, providing a measure of the maximum relative error in the measurements.
 Figure 9. Difference between temperature set point and averaged measured temperatures for the four thermistors on the XRS ETU |
 |
(15) |
The results are shown in this table:
| Thermistor | TrangeERROR in °C |
| A1 | 0.012 |
| A2 | 0.039 |
| B1 | 0.042 |
| B2 | 0.017 |
While the absolute errors ranged from –0.09°C to 0.13°C, the largest relative error for a thermistor was 0.04°C. The relative errors were on the order of a third smaller than the absolute errors for these measurements.
Improving Accuracy: Temperature Baths
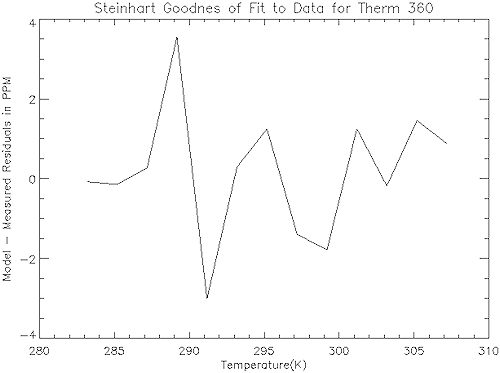
The Total Irradiance Monitor instrument designed at LASP requires extremely accurate temperature measurements to correct for temperature effects on photodiode behavior. To achieve accuracies better than those listed in the thermistor datasheets, LASP purchased a Fluke 4731 thermal bath that is stable to ±0.005°C and uniform to ±0.005°C when using ethanol in the bath. The bath is programmed to dwell at multiple temperatures spanning the desired operational range of the thermistor. A Keithley Ohm-Meter measures the thermistor's resistance, averaging 40 minutes worth of measurements at each of multiple temperatures in the desired measurement range. These temperature and resistance values are used to solve for coefficients a, b, and c in the SH-H equation (Equation 13), using a least-squares fit algorithm. Figure 10 shows the residuals (the observable estimates of the unobservable statistical error) when applying the resulting SH-H equation to a thermistor.
 Figure 10. Residuals for estimating temperature using the Steinhart-Hart equation after solving for the SH-H coefficients using the thermal bath calibration data |
The error in estimating temperatures from 10°C–35°C is less than ±4 ppm, or 0.0004%. At 289 K, the error is then:
TerrorMAX = 289(4×10⁻⁶) = 0.0012°C
TerrorAVG = 0.0003°C
The plot in Figure 10 was taken from one of the worst performers of a batch of 10K3MDC1 thermistors. It therefore can be compared to the 3σ errors in Figure 1. Although Figure 1 also includes electronics-induced errors in the measurement, the increasing error at low temperatures is a function only of the thermistor and would be eliminated by using the bath calibration method to characterize the sensor's behavior. Assuming 0.0012 is the 3σ error for temperatures >10°C for the thermistors calibrated in the thermal bath, the bath calibration resulted in error figures that were almost 167 times smaller than those obtained by using datasheet values.
Summary
We have shown that a resistor divider with a thermistor is approximately linear over a large range of temperatures if we solved for the fixed resistance as in Equation 3. We derived equations for the gain and offset of an amplifier circuit that would produce an output voltage from the divider spanning the range from zero to the maximum input voltage of an ADC. We found that the Steinhart-Hart equation provided a very accurate method of estimating the temperature using the measured circuit output voltage. We discussed Monte Carlo analysis techniques, and described an example that produced the expected 3σ errors for estimating temperature. We measured the temperatures from four thermistors on the same circuit board as the system was controlled from 0°C to 21°C, achieving the maximum absolute errors of –0.09°C to 0.13°C in contrast to the 3σ error that was estimated to be ±0.2°C over this same temperature range. The largest relative error in the measured temperatures for any one thermistor was 0.04°C. The results clearly show that it is possible to use a thermistor to provide accurate temperature monitoring over wide temperature ranges.
ABOUT THE AUTHORS
Darren O'Connor is an Electrical Engineer at the Laboratory for Atmospheric and Space Physics, University of Colorado, Boulder, CO. He can be reached at [email protected].
Kasandra O'Malia is a Calibration Engineer at the Laboratory for Atmospheric and Space Physics, University of Colorado, Boulder, CO. She can be reached at [email protected].