
In the first part of this two-part article, we introduced the new Endevco damped, high-shock 20,000 g piezoresistive accelerometer and described the characterization of its dynamic behavior using the Hopkinson bar. This second part of the article describes the additional testing performed to establish the new sensor's response to shocks, damping behavior, and frequency response. In addition, it also describes a new test fixture for use with SMT accelerometers and shares results obtained when the high-shock accelerometer was subjected to Very High G (VHG) shock testing.
Zero Shift after Shock
Figure 10 shows the zero measurand offset (ZMO) data taken from a new damped unit vs. the industry standard undamped unit over various shock levels. Low zero shift after shock is critical in many high-acceleration shock applications because high zero shifts result in erroneous integration of the accelerometer's output to obtain velocity (or displacement) information.
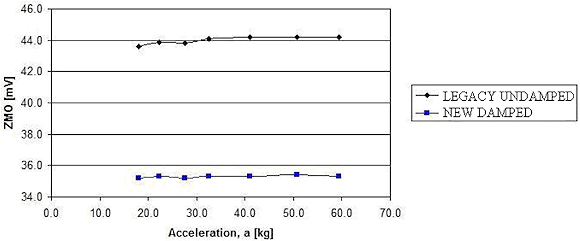 Figure 10. ZMO tracking after successive shocks of increasing acceleration level |
Damping
Squeeze-film damping was briefly described in part one of this article. For reference, squeeze-film damping is basically the squeezing and displacing of air as one movable plate approaches a fixed plate; the trapped air is the source of the damping. Characterization of the damping in the new damped accelerometer is an ongoing effort. The current technique uses the log-decrement method of successive peaks, shown in Figure 11, to calculate the damping ratio (ξ). One calculation, made by the team of engineers at Eglin AFB, calculates the damping ratio to be between 1% and 2%.
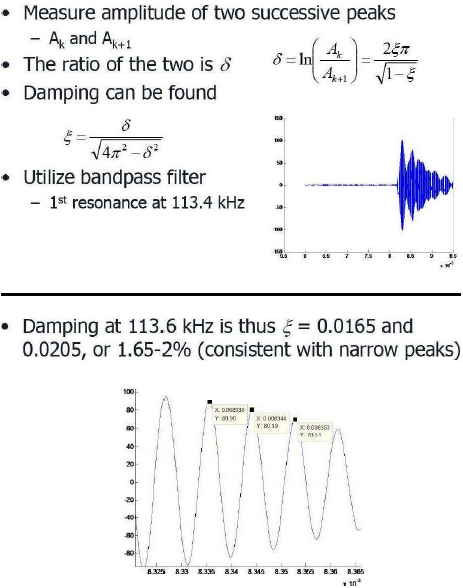 Figure 11. Description of log-decrement method (A) and damping calculation (B) by AFRL |
Another method for measuring damping, performed by engineers at Meggitt Sensing Systems, San Juan Capistrano in Sunnyvale, CA, mechanically lifts the proof mass to its stops and then releases it, producing a displacement equivalent to 20,000 g acceleration. Figure 12 shows the damping to be between 9% and 17% for a sampling of the new damped 20,000 g MEMS sensors.
Figure 12. Results of damping experiment conducted at maximum displacement of proof mass
| Unit 1 | Unit 2 | Unit 3 | Unit 4 | Unit 5 | |
| Natural Frequency, fn(kHz) | 110 | 93 | 111 | 113 | 113 |
| Damping Ratio, ξ | 0.11 | 0.09 | 0.12 | 0.13 | 0.17 |
This 20,000 g sensor design uses squeeze-film damping which is dependent on the displacement of the proof mass relative to the mechanical stops. One could expect the squeeze-film damping to be less effective at low displacements and to become more effective at larger displacements (±20,000 g). Although this hypothesis has been proposed to explain the discrepancy between the measured values for the damping ratio obtained using the two different methods, there will be ongoing work to better characterize this parameter. In either case, the damping does not affect the accelerometer's linearity in its rated range and, when combined with the mechanical stops, it greatly improves the sensor's survivability at shock levels up to 4X the rated range.
Mechanical Stops
The lid and the base of the three-wafer stacked sensing element serve as the mechanical stops, which are set to engage between two and three times full range in both positive and negative directions. Due to the nature of squeeze-film damping, the stops are observed as "soft" stops where there is no observable flattening, or clipping, of the waveform. There is no sudden change in momentum as the proof mass approaches the mechanical stops; instead, the stops are seen as a gradual reduction in sensitivity as the proof mass approaches the physical hard stop. "Soft" stops can be thought of as gradual or progressive stops. Referring to Figure 9, the stops of this accelerometer are shown to engage near 40,000 g (or two times the full range) where the sensitivity begins to drop below the extrapolated curve of the linear sensitivity shown in the calibration range (0 g to 20,000 g).
The stops have little effect on the ZMO of the unit, as can be seen in Figure 10, for acceleration levels above 40,000 g (i.e., engaging the mechanical stops does not generate large zero shifts). Additionally, the mechanical stops are not point stops, so there is no danger of debris generation from multiple overrange shocks.
Frequency Response
Figure 13 shows the transfer function for the new damped accelerometer compared to the Laser Doppler vibrometer (LDV). The frequency response was measured by graphing the transfer function between the test accelerometer and LDV. The plot in Figure 13 indicates a good frequency response out to at least 10 kHz with reasonable response out to 40 kHz. The natural frequency of this particular damped unit is 113.4 kHz. The peaks at 148.9 kHz, 170.6 kHz, and 171.4 kHz may be either higher resonant modes of the damped accelerometer or artifacts of the test fixture.
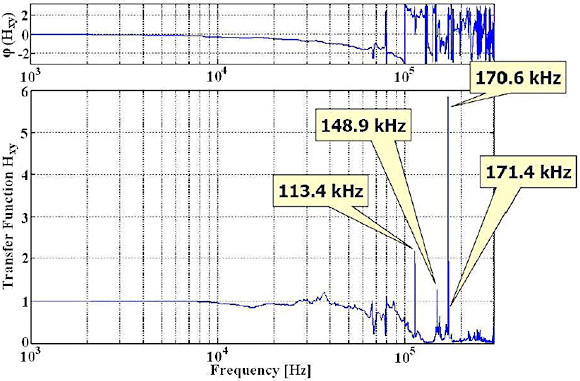 Figure 13. Accelerometer-to-LDV transfer function |
Test Fixture for Laboratory Testing
Surface mount technology (SMT) packages used for high-g shock applications pose a particular challenge for testing because the typical handy carrying case, with bolt holes and integral cable, is missing. The new damped LCC-packaged accelerometer needed to be tested for high-g shock survivability in a production environment, and therefore a new fixture was required—one that would not introduce spurious frequencies into the data over the acceleration levels to be tested. Furthermore the fixture had to be relatively easy to assemble, protect the wiring from a hostile environment, and allow the accelerometer to be easily removed from the fixture for packaging and shipment.
The resulting fixture, shown in Figure 14, can retain the accelerometer at shocks above 200,000 g. Depending on the acceleration levels to be tested, two different temporary adhesives are used that offer varying levels of ease of installation and clean up. The new test fixture shares the same bolt pattern as the industry standard undamped accelerometer, which eliminates the need for additional custom tooling in the laboratory environment. Test results confirm that the fixture has no significant effect on frequency response up to 100 kHz.
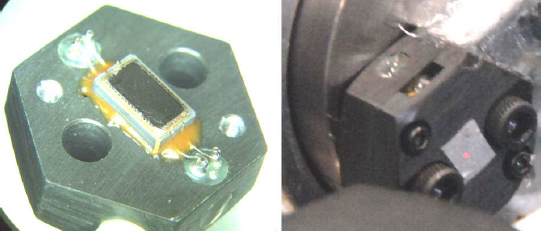 Figure 14. Test fixture for laboratory testing of the LCC-packaged accelerometer |
VHG (Very High G) Shock Testing
In October 2010, a series of tests were run on the VHG (Very High G) shock machine (Figure 15) at the AFRL Fuzes Lab at Eglin AFB. A legacy undamped 60,000 g accelerometer was used as the reference accelerometer. The VHG does not have the high g capability of the Hopkinson bar, but it imposes more high-frequency inputs into the test unit, and is considered a more realistic simulated environment for weapons testing. Accordingly, VHG testing is important to ensure the survivability of a device that will be subjected to fuze environments.
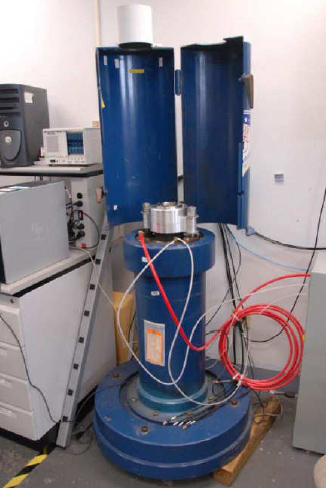 Figure 15. The Very High G (VHG) shock machine at Eglin AFB |
The common sequence for weapons fuze testing is Hopkinson bar, VHG, cannon, sled, and then flight test. To measure survivability, this sequence progresses from the easiest to the hardest. Thirteen VHG tests were conducted on the new damped 20,000 g accelerometer with peak inputs ranging from 6000 g to 50,000 g. The output of the accelerometer was monitored during each shock, but the most important measure of survivability was the zero shift that resulted from the shock. The zero shift of the damped accelerometer, even after multiple 50,000 g shocks (2.5X range), was not measurable with the DA system as configured. The LSB (least significant bit) of the DA system was 50 µV, and the ZMO (zero offset) of the damped test unit toggled between –17.4 and –17.5 mV over the thirteen-test sequence.
In Figure 16, the accelerometers shown mounted on the VHG are a legacy undamped 60,000 g accelerometer, a new damped 20,000 g accelerometer mounted inside an Endevco high-g test fixture, a prototype damped 60,000 g accelerometer, and a mechanically-isolated version of the legacy undamped 60,000 g accelerometer.
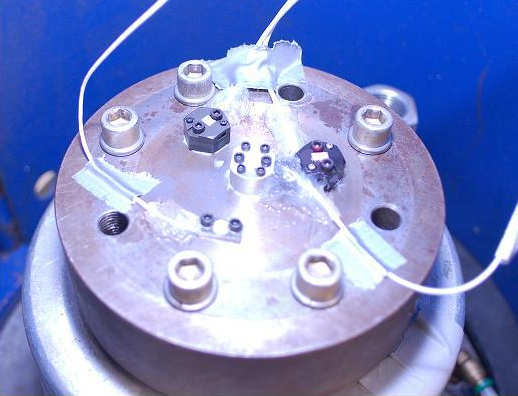 Figure 16. Suite of Endevco accelerometers mounted to the top of the VHG shock machine |
Figures 17 and 18 show representative plots at 20,000 g and 50,000 g, respectively, with the data processed through two different filters. As expected, the sensitivity matches well to the standard accelerometer at full range (20,000 g) and is only 20% down at 50,000 g, which is 2.5X full range.
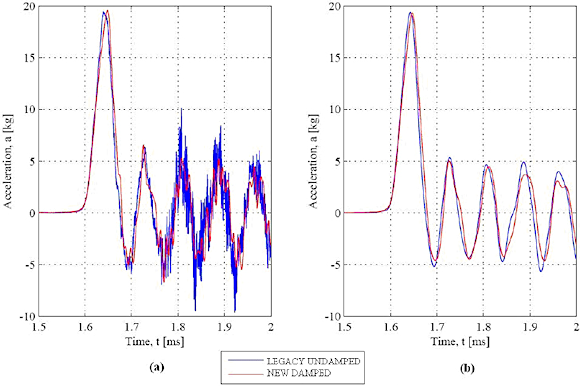 Figure 17. VHG shock plot at approximately 20,000 g with the data filtered at (A) 204.5 kHz and (B) 40 kHz |
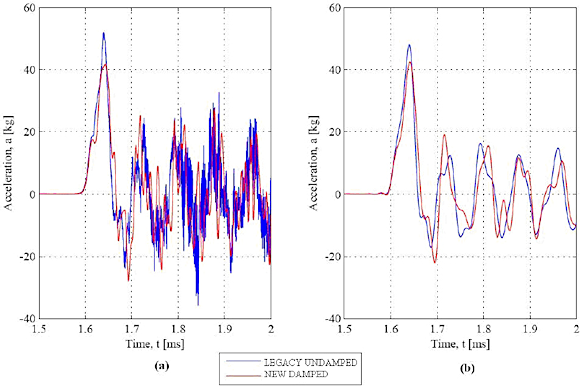 Figure 18. VHG shock plot at approximately 50,000 g with the data filtered at (A) 204.5 kHz and (B) 40 kHz |
Test Data for First Production Units
The scatter graphs in Figures 19 to 22 include data from the units in the pilot production run, which used MEMS die from three different wafer lots. The plots are sensitivity, ZMO, bridge resistance, and zero shift after shock.
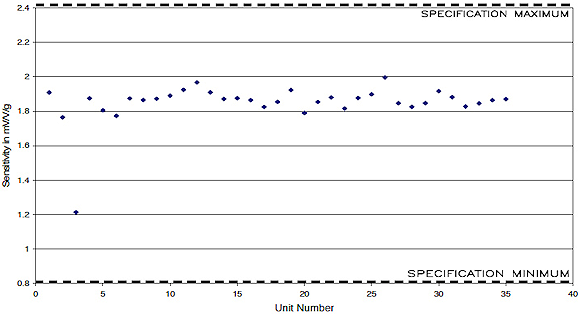 Figure 19. Sensitivity scatter plot for the damped 20,000 g accelerometer pilot production build |
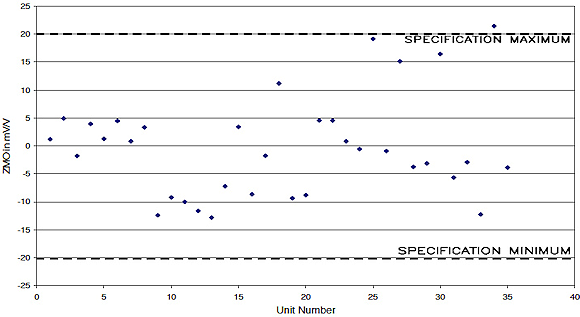 Figure 20. Zero measurand offset (ZMO) scatter plot for the damped 20,000 g accelerometer pilot production build |
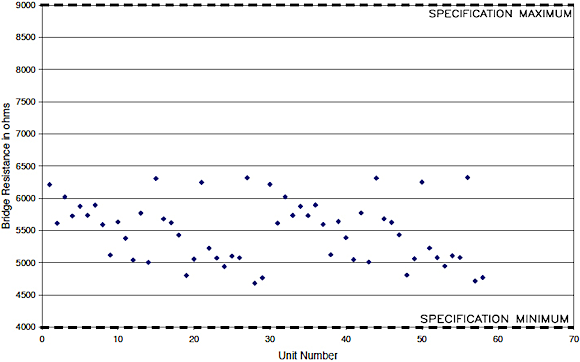 Figure 21. Input/output resistance scatter plot for the damped 20,000 g accelerometer pilot production build |
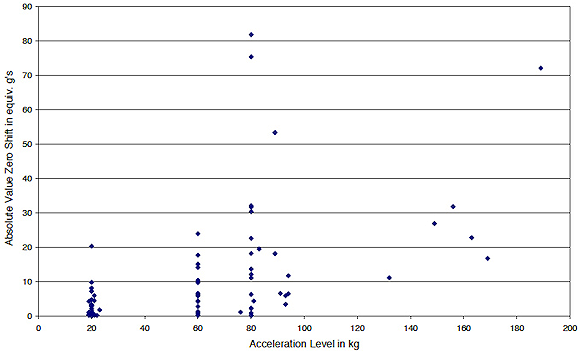 Figure 22. Scatter plot of zero shift after shock in the sensitive axis for the damped 20,000 g accelerometer pilot production build (34 units) |
Summary
Further characterization of production damped, high-g shock 20,000 g accelerometers has been conducted at the Dynamic Shock Facility of the Air Force Research Laboratory at Eglin Air Force Base.
Testing at Meggitt Sensing Systems, San Juan Capistrano, and Eglin AFB confirms the new damped 20,000 g accelerometer has:
- Shock survivability to at least four times full range
- Minimum zero shift after shock
- Damping between 2%–10%, depending on how the measurement is made
- Excellent linearity to at least 1.5X full range
- "Soft" stops that, combined with damping, result in excellent survivability
- Frequency response flat within 1 dB to at least 10 kHz
The series of tests conducted at Eglin AFB demonstrate both excellent test repeatability and high data integrity as represented by the various plots included in this article, including the plot of coherence to 90 kHz. These results validate both the quality of the measurements and the satisfactory performance of the new damped 20,000 g accelerometer.
The test results we have presented here encourage us to continue with the design evaluation testing, both at Meggitt Sensing Systems and at the Eglin AFB Shock Laboratory. We welcome all other high-g shock facilities to evaluate our new accelerometer design using their own test equipment.
Acknowledgements
The authors would like to thank Zhixiong Xiao at Meggitt Sensing Systems in Sunnyvale, CA, for his work on MEMS development and damping experiments, and to Carroll Barbour for conducting the Hopkinson bar test program at Meggitt Sensing Systems in San Juan Capistrano, CA. Additionally, the authors extend our appreciation to the team at the Dynamic Shock Facility of AFRL at Eglin AFB for their high quality, thorough evaluation of our new damped high-shock accelerometer.
ABOUT THE AUTHORS
Randy Martin is the Director of Mechanical Engineering, for Meggitt Sensing Systems North America and can be reached at 949-493-8181, [email protected].
James Letterneau is a Transducer Design Engineer for Meggitt Sensing Systems in San Juan Capistrano, CA, and can be reached at [email protected].
Tom Kwa is the MEMS Design and Development Manager for Meggitt Sensing Systems in Sunnyvale, CA and can be reached at [email protected].