

Determining oil quality on demand is a critical need in the asset maintenance and reliability industries, both to empower engineers and field personnel and to provide complementary oil condition information. Current methodology involves testing in off-site labs; this is non-optimal and costly due to the logistical challenges of shipping samples and the time delay in receiving information for personnel who need to make quick and informed decisions.
Measuring the viscosity of an oil is a rapid way to determine its condition and is considered an important parameter in assessing equipment readiness. Vectron has introduced real-time, online, bolt-on, threaded viscosity sensors that can complement IR spectroscopy and other bulk property sensors. They can provide instantaneous online viscosity and
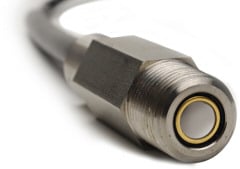 Figure 1. Vectron's ViSmart real-time, online, bolt-on viscosity sensor |
A low-shear viscosity sensor (Figure 1) can measure the acoustic viscosity (AV), the product of dynamic viscosity (DV) and mass density. Because DV or kinematic viscosity (KV) is more commonly used in the oil condition monitoring industry, this article includes methods to establish the correlation between AV and DV. We also present data on some fluids that exhibit shear-rate-dependent viscosity.
The Test Protocol
The synthetic and mineral oils tested fall into two categories: clean and contaminated. In this article we present only the synthetic oil test results.
The viscosity values for the oils were measured with TA Instruments AR2000 rheometer equipment at 30°C, 40°C, 60°C, and 100°C. Based on this data, we planned to generate an interpolation function for the viscosity for intermediate temperatures and this function was thought to fit the form of Equation 1:
| (1) |
where:
| cSt | = | kinematic viscosity |
| B, A0, A1, A2 | = | empirical constants |
| TKelvin | = | temperature in Kelvin |
yielding Equation 2:
| (2) |
Density values, obtained from a pycnometer, were also measured at 30°C, 40°C, 60°C and 100°C. The generated density function was of the form of Equation 3:
| (3) |
where:
| ρ | = | density |
| ρ0, ρ1, ρ2 | = | density values determined for curve fit |
The viscosity at each of the four temperatures was measured at 1000 s–1, 3000 s–1, and 10,000 s–1 in addition to the standard shear rate of 512 s–1. Therefore each oil sample has a viscosity value measured at a specific temperature and at a specific shear rate. Finally, we used these measurements as a reference to compare with those obtained using Vectron's bolt-on low-shear viscometer.
Correlation of AV and DV
The viscosity data for all known synthetic oils are plotted and curve fitted in Figure 2. All of them are Mobil synthetic oils. These are then divided into two groups, Mobil SHC 639 alone and all other synthetic oils. If we use one curve to fit all the synthetic oils, the correlation factor is 0.9249; correlation accuracy increases to 99% using the two groups specified (Figures 3 and 4).
 Figure 2. Correlation between viscosity and acoustic viscosity, for synthetic oils, measured at various temperatures and with a shear rate of 512. The solid line is the fitted curve for the relationship between the lab viscometer and the ViSmart solid-state sensor, while the diamonds are the actual measurement data points |
 Figure 3. Correlation with synthetic oil Mobil SHC 639. Measurements performed for Mobil SHC 639, at various temperatures, and at a shear rate of 512 |
 Figure 4. Correlation with synthetic oils without SHC 639. Measurements performed for Mobil synthetic oils (but not SHC 639), at various temperatures, and at a shear rate of 512 |
It is important to note that Figure 3 links the correlation function to a single oil; observe the 99% accuracy for the solid-state viscosity sensor.
All the correlation equations are in the form of Equation 4:
| (4) |
where:
| X | = | acoustic viscosity (AV) |
| Y | = | dynamic viscosity (DV) |
| A, B | = | parameters that depend on oil types |
Notice that the correlation function is not as complex as previously noted.
Rheological Study: Compensation of Shear Rate
 Figure 5. Graph of dynamic viscosity vs. shear rate illustrates a mechanical resonance issue at 2000 s–1 and significant heating due to internal frictional dissipation above 1000 s–1 (Click image for larger version) Figure 5. Graph of dynamic viscosity vs. shear rate illustrates a mechanical resonance issue at 2000 s–1 and significant heating due to internal frictional dissipation above 1000 s–1 (Click image for larger version) |
- The viscosity shear-rate slope is large at 30°C, smaller at 40°C and 60°C, and almost flat at 100°C. If it were caused by shear thinning, we should see it at all temperatures. Because viscous heat (power) is proportional to viscosity, the viscous heating effect is very weak at 100°C where viscosity is low.
- Radiation heat loss also increases with the temperature difference, so at 100 °C the heat is more rapidly radiated to ambient.
- Most oils are poor thermal conductors. There will be a temperature gradient between the bulk material and the boundary layer in the viscometer, but the boundary temperature can be well controlled.
These effects complicate the problem and generally make the actual oil temperature in the viscometer higher than the set temperature.
The viscous heat (H) for cone-and-plate viscometer can be calculated using Equation 5:
| (5) |
where:
| τ | = | shear stress in lb./in.2 |
| γ | = | shear rate in s–1 |
| η | = | dynamic viscosity in centipoise |
| ω | = | angular velocity, in radian/s |
| R | = | outer diameter of the cone in in. |
| α | = | angle between cone and plate, in radian |
The heat generation can be very large at high shear rates, since the heat is proportional to the square of angular velocity.
Since viscous heating is more dominant than shear thinning at a high shear rate in a cone-and-plate viscometer, the viscosity data taken in this setting is not suitable for rheological study. To study the shear rate dependence of viscosity, we intend to investigate other methods to accurately measure viscosity at high shear rates.
In Summary
We have developed correlation functions that relate the solid-state real-time in-line sensor data to that gathered using an ASTM lab rheometer, enabling a low-shear sensor to trend and track viscosity data in a similar fashion to a lab tool.
We have calculated the constants in the interpolation function between KV and temperature in Kelvin at each measured shear rate and used the sensor to obtain the functional dependence of the constants on shear rate for each oil examined. We determined a look-up function to allow an oil viscosity (kinematic, dynamic, or acoustic) to be interpolated at an assumed temperature and shear rate. Finally, for each oil, we evaluated a pair of correlation functions to convert between the measured AV and interpolated KV and determined the correlation (R2) for individual oils and groups of oils.
The data conclusively demonstrate that there exists a correlation between results generated by the lab method and by the viscosity sensor for each oil (or group of oils) and that a library of "fresh oil" correlations is practical. Evaluating deviations in AV is of comparable value to using KV; that is, independent and accurate knowledge of density is only important for correlation between on-site sensor testing and lab data.