

The mixed domain oscilloscope (MDO) offers a powerful addition to the designer's toolset because it lets the designer make simultaneous time and frequency measurements when testing designs. If you are considering an updated, faster or more modern oscilloscope to support your sensor design efforts, should an MDO be on your short list?
In this article we'll discuss the kinds of insights an MDO can give that in some instance would otherwise not be possible. We'll then show hands-on examples of several situations where using an MDO to make calibrated time and frequency measurements can make tedious jobs easier throughout the design process.
Mixing Domains
Mixed time and frequency domain oscilloscopes that combine support for many functions in a single box are a relatively new addition to the oscilloscope landscape. In addition to all the capabilities of a digital oscilloscope, other functions found in the latest integrated instruments include spectrum analyzer, logic analyzer, protocol analyzer, arbitrary function generator and digital voltmeter (DVM). In many cases, these functions can be added when needed, so you won't need to pay for extra functionality before it's needed.
Use cases for an integrated oscilloscope are not limited to RF applications. Even for designs without wireless technologies, engineers are facing EMI, crosstalk, and noise-related issues that are easier to diagnose in the frequency domain than in the time domain. Understanding the emissions profile of a product under test at all test frequencies often requires the ability to see those frequencies at the same time, to avoid missing a critical event.
Single-Domain Oscilloscope Limitations
Let's go back to that oscilloscope you may already own. Isn't it sufficient as it is, as most oscilloscopes are already able to calculate and display a Fast Fourier Transform (FFT) of the acquired time domain signal?
While FFT can be useful for a number of applications, it is no replacement for a full-blown spectrum analyzer. An input capable of measuring high frequency signals is required for making spectral measurements. Many modern communications signals operate in the ISM bands at 2.4 and 5.8 GHz. Even making measurements on a relatively low frequency 900 MHz system requires an input frequency range of 2.7 GHz in order to examine the third harmonic.
What's more, the spectrum is limited to the bandwidth of the oscilloscope. While oscilloscopes are available with bandwidths that can measure these signals, it will cost you a whole lot more to buy one than you would otherwise need for analysis of analog or digital signals.
Equally important is signal fidelity, and the most important measure of fidelity is the Spurious Free Dynamic Range (SFDR) value. Most oscilloscopes provide a paltry ~45 dBc SFDR, much worse than the ~60 dBc provided by spectrum analyzers.
Next page
MDOs Hit Center Stage
A MDO avoids the aforementioned limitations by incorporating a complete spectrum analyzer, with an RF input alongside the digital and analog channels. The RF channel in the MDO has a flat frequency response across the entire frequency range, leading to more accurate measurements and an SFDR rating of up to -65 dBc (typical).
MDOs have a universal trigger system that is correlated across all the channels, including the RF channel. A trigger can be set on any one of the analog, digital, or RF channels. When the trigger event occurs, the MDO captures all channels simultaneously. As a result, all signals are time-correlated for accurate analysis. Figure 1 shows a synchronized acquisition of multiple channels including RF. Since all waveforms are time-synchronized, it is possible to see the RF spectrum at the same point in time that a significant event occurred on an oscilloscope channel, such as a specific serial bus pattern or ripple on a power rail.
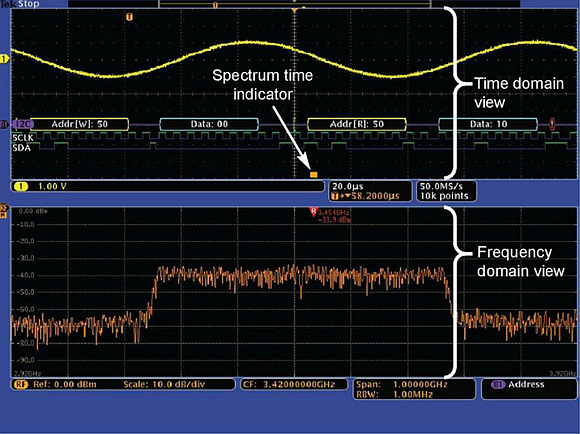
Fig. 1: A high performance MDO can show time and frequency domain views on a single screen.
A particular challenge with modern wireless communications such as WiFi, Bluetooth and ZigBee is that they use increasingly wide bandwidth modulation schemes to provide greater data throughput. In order to effectively measure these technologies, you often need to capture the entire channel bandwidth at a single point in time. But traditional swept or stepped spectrum analyzers have only a 10 MHz capture bandwidth; thus, they can see only a small portion of the spectrum at once.
An MDO, however, can acquire the entire spectrum of interest up to a very wide 3.75-GHz capture bandwidth. This provides you with much better insight into modern wideband RF signals. These signals often vary significantly with time and use sophisticated digital modulation schemes or transmit using RF bursts.
The following are several examples of how an MDO can be used to support a range of common engineering test and debug tasks.
Debugging A Noise Source
MDOs are useful for tracking down the source of noise in a design. In this example, a very high-frequency signal riding on one of the low-frequency signals was discovered while probing around the circuit board. Using a cursor measurement in the time-domain display, the dominant noise was seen at about 900 MHz.
Switching to the frequency domain display, a near-field probe was used to capture radiated signals. The display's center frequency was set to 900 MHz and the span set to 2 MHz. Then the near-field EMI loop antenna was slowly moved over the circuit board looking for the highest signal level at 900 MHz. The strongest signal was found at the output of a clock generator circuit in an FPGA as shown in figure 2.
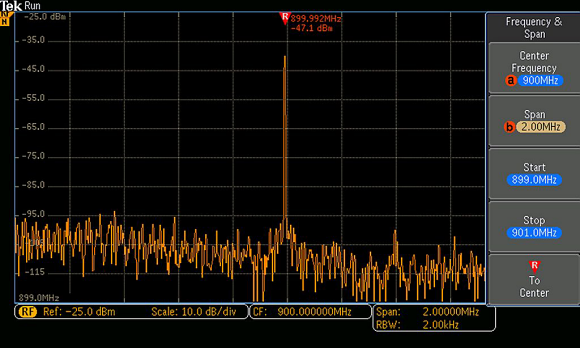
Fig. 2: Strong 900 MHz radiation was detected at the FPGA.
In this case, the signal appeared to be fairly stable. After examining the FPGA layout, it was determined that the signal corresponded to the ninth harmonic of the 100 MHz Ethernet clock – a poor circuit board layout resulted in magnetic coupling to other signals in the design.
Next page
Troubleshooting Embedded And IoT Designs
The explosion of wireless technologies in embedded and Internet of Things (IoT) designs brings with it the need for new tools to test and troubleshoot designs that use Wi-Fi, Bluetooth, ZigBee, and other wireless standards. Many such wireless applications call for serial communications between the radio system and other parts of the product. When it comes to debugging a design that combines high-speed serial signals with RF, an MDO really excels as you can quickly switch between time and frequency domains to track down the root cause of a problem in a particular design.
The MDO's trigger, search, and analysis tools can easily identify analog and digital anomalies and display the RF spectrum at any point in time. Often overlooked is the MDO's ability to decode, trigger, or search on serial buses, including I²C, SPI, USB, RS-232, CAN, LIN, FlexRay, Ethernet, MIL-STD-1553, I²S, and many others.
Two examples below illustrate tests to verify radio operation in a ZigBee-based setup. An amplified radio module is used with demonstration board and an MDO, as shown in figure 3. The microcontroller IC and modules use a four-wire SPI connection to control the radio IC and any related components, such as a power amplifier. Setup and data commands are sent from a PC to allow manual control. Note that a direct connection to the radio is used to facilitate power and other measurements.
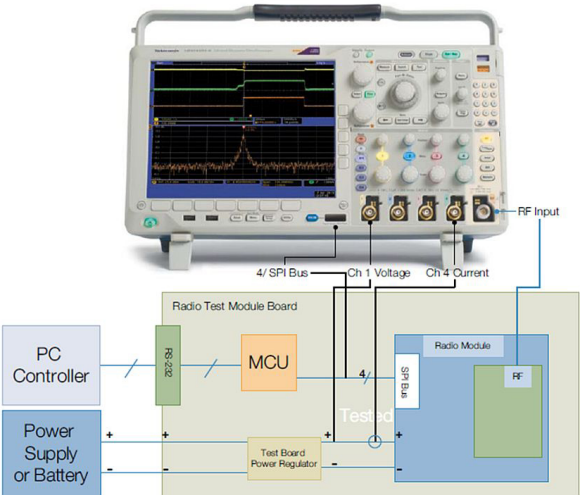
Fig. 3: Illustrated here is a test setup for verifying wireless radio operation. It uses a ZigBee module, a Tektronix MDO4000B series mixed domain oscilloscope, a microcontroller, and demo board.
Using An MDO For RF Compliance Testing
The MDO's capability for simultaneous viewing of the radio spectrum and power supply make compliance testing a fairly straightforward matter. The specified channel spacing for ZigBee is 5 MHz. The 20-dB channel bandwidth should be significantly less than the channel spacing. The measured occupied bandwidth of 2.3 MHz is well within the specification, as shown in figure 4. The output power is expected to be in the range of 20 dBm.
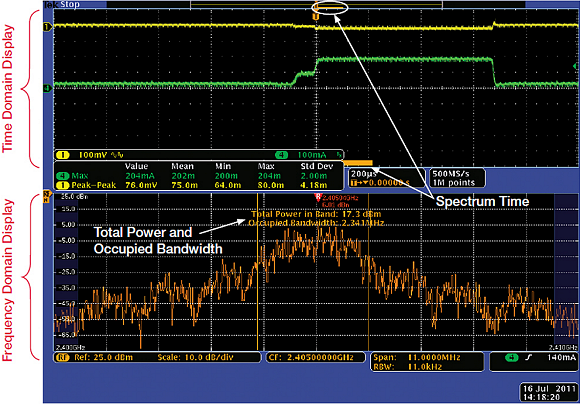
Fig. 4: This shows the time domain and frequency domain displays of a Tektronix MDO4000B series mixed domain oscilloscope. The orange bar in the upper display represents the Spectrum Time, which correlates to the time period of the spectrum trace displayed below.
In Figure 4, you can see the output spectrum in the lower part of the screen, and direct measurements of bandwidth and power. The test cable drop is about 2 dB in this frequency range, meaning the power measurement is in the range of what is expected.
On the top half of the screen (the time domain display) you can see a fat orange bar along the bottom, called the "Spectrum Time" bar. This bar correlates to the time period of the spectrum trace shown in the frequency domain display below. The Spectrum Time is defined as the window shaping factor divided by the resolution bandwidth (RBW). Using a dial, you can move the Spectrum Time bar across the time domain window, allowing the spectrum and measurements to be taken at any time during packet transmission. The acquisition shown here correlates to the point just after turn-on.
Next page
Testing And Troubleshooting Power Conditions
When it comes to understanding radio transmitter performance during low battery conditions or when the power supply is current-limited, during compliance testing, MDOs are quite useful. In this example, to simulate a depleted battery, a 1.5 ohm resistor is placed in series with the module, as shown in Figure 5.
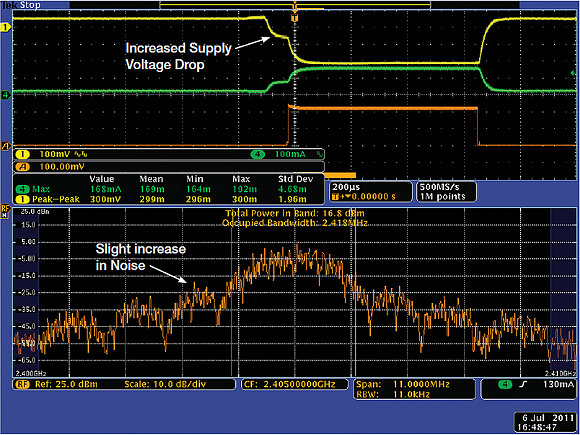
Fig. 5: An MDO's ability to display the time and frequency domains simultaneously makes it ideal for testing and troubleshooting low power conditions. Shown here is the impact on noise from a simulated depleted battery.
You can see that the current drawn by the module is only a few milliamps lower, but the voltage drop is about 230 mV. The output power is reduced by 1 dB as measured by the RF power measurement. The spectrum display clearly shows a slight increase in the adjacent channel noise. You can also see the lower output on the Amplitude versus Time trace (Trace A).
Measuring Power In The IoT World
The buzz around IoT continues to build. IoT, of course, refers to networks of physical objects, devices, vehicles, buildings, and other items, within which are embedded electronics, software, sensors, and network connectivity devices.
An online community specifically for engineers, element14 recently held a design challenge in order to spur innovative IoT development. Entitled "Forget Me Not", the challenge was to deliver an IoT solution that would allow consumers some peace of mind while taking a vacation holiday by, for example, monitoring household conditions while they're away. The challenge required using a core kit of a Raspberry Pi credit-card sized computer, a sensor kit, and a low-end oscilloscope.
For one project, a contestant used an oscilloscope to measure the power consumption of two different Raspberry Pi models as they ran his design. Here, one contestant's project required finding out which Raspberry Pi system consumes less power - the B or the B+ model. This was particularly important, as his project, a portable kiosk in India, needed to run using batteries only. Figure 6 shows his set up.
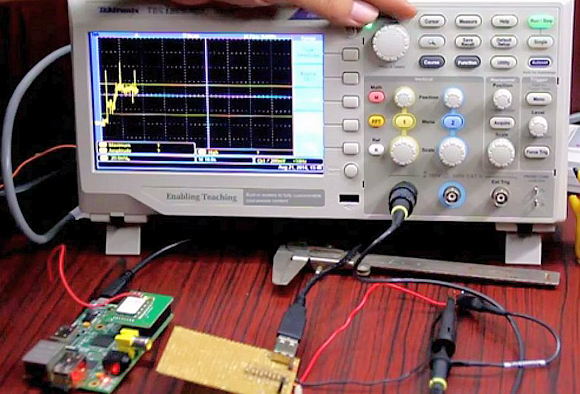
Fig. 6: This illustrates the setup for using an MDO to make power measurements of a Raspberry Pi computer system.
In figure 7, the Raspberry Pi "B" model has been connected to an MDO. Automatic Peak Current cursor measurements are taken, showing the peak at 840 mA. Comparable measurements will be made using a "B+" model, helping answer which system uses less power.
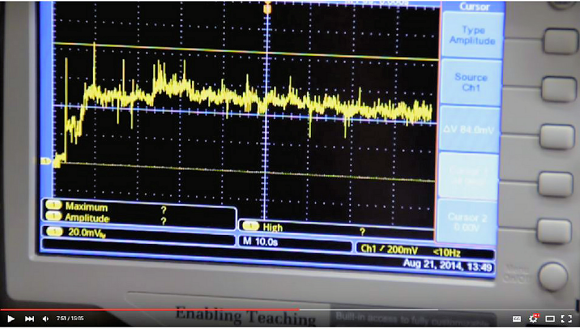
Fig. 7: Here, Automatic Peak Current cursor measurements are taken, showing the peak to be 840 mA.
Summary
With its simultaneous display of the time and frequency domains, along with its integrated spectrum analyzer, the ability to trigger on all channels simultaneously, a wide capture bandwidth and other built-in functionality, the mixed domain oscilloscope provides designers with insights, value and convenience they would not otherwise have.
About the Author
Varun Merchant is a Mainstream Technical Marketing Manager for Tektronix, supporting mid-range wireless and power conversion product offerings. Before joining Tektronix, he worked for several years in product development and design in the semiconductor industry. He holds an MSEE from the University of California, Santa Barbara and an MBA from the Stern School of Business, NYU.
Related Stories
The Intersection of Test and the Internet of Things
Test Considerations for Automotive Sensors