

The world's 17 species of penguin are indigenous only to the Southern Hemisphere, including the Antarctic. Gentoo, Macaroni, and King penguins are anything but native to Pittsburgh, PA, but nonetheless are very much in their element at the Pittsburgh Zoo and PPG Aquarium, thanks to a sophisticated system of sensors and a wireless network that keeps everything in balance.
The birds thrive at temperatures below 50°F, and it is important to maintain them at those low temperatures to avoid heat stress and decrease susceptibility to disease. Pittsburgh summers can bring 90°F weather, making the air chillers in the penguin habitat work overtime. Identifying performance issues and predicting failure for the air chiller system and associated power supplies—before the situation becomes critical—provides valuable corrective action time.
Rather than rely on visual observations, temperature and humidity are electronically monitored in various locations within the exhibit. Because intrusion into and disruption of the exhibit would compromise the structure and stress its feathered inhabitants, wireless temperature sensors provide the only realistic solution.
Reliable Monitoring amid Piping, Pumps, and Penguins
To create a natural environment for the penguins (Figure 1), the exhibit consists of masonry block and concrete walls, fiberglass-reinforced plastic scaffolding and walkways, metal railings, piping and pumps for water circulation, and metal and wire underlayment within the artificial rock and brick. These surroundings provide a fairly harsh environment for common, low-power radio frequency (RF) communication.
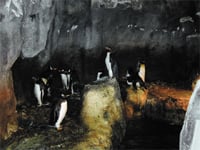 Figure 1. Three species of penguin enjoy the ambient conditions of their native habitats— thousands of miles from home |
For ease of deployment, simplicity in configuration, and reliability in communication, the implementation team selected components from the Sensicast SensiNet wireless sensor network coupled with IntelliSensor's NiteWATCHMAN sensor data management software.
As in any real-world application of intelligent wireless system networks, cost and reliability are major concerns. The penguin habitat added a nonintrusion factor to these requirements. IntelliSensor performed an engineering evaluation of the site that determined that the placement of six wireless temperature and humidity sensors would provide reliable data acquisition and adequately measure the temperature profiles necessary (Figure 2).
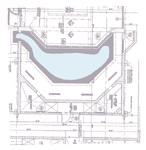 Figure 2. Deployment pattern used for reliable temperature and humidity monitoring |
Six Nodes Send Reliable Signals
Node 1. The first SensiNet Smart Sensor for temperature and humidity is located in a shaded area on the roof to measure the outside air temperature.
Node 2. The second temperature sensor is just inside and to the left of a steel door to the isolation area of the exhibit.
Node 3. The third temperature sensor is inside the isolation area of the exhibit behind a plastic grate which, when open, permits the penguins to enter the isolation area. This acts as a redundant temperature and humidity sensor.
Nodes 4, 5, and 6. Node 4 (Figure 3) is inside the exhibit, hidden from view behind a simulated rock ~3 ft. above the penguin floor and is the primary temperature sensor. Node 6 is inside the exhibit on a reinforced concrete walkway ~15 ft. above the penguin floor, where it measures temperatures ~10 ft. below the roof of the exhibit. Temperature sensor Node 5 is also above the penguin exhibit floor, ~6 ft. higher than Node 6 and at the opposite side of the exhibit.
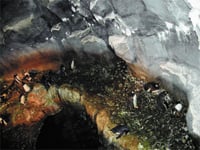 Figure 3. SensiNet Node 4 is hidden behind a simulated rock 3 ft. above the exhibit floor |
The SensiNet Smart Sensors were quickly and unobtrusively installed and are invisible to spectators. Since the sensors operate off batteries that last up to three years, installation was fast and easy. Installing wired sensors would have required cutting through the concrete and simulated rock and disrupting the exhibit while the work was going on—disappointing the visitors and irritating the penguins!
Collecting, Viewing, and Analyzing the SensiNet Data
IntelliSensor developed custom software that records the measured temperatures and humidity values in a database, prepares reports, and graphs the data for specified intervals. It provides for alarms to be issued to a pager or telephone if a predetermined level is exceeded. Network administration reports are issued via email at hourly intervals, providing the current temperature, humidity, state of battery charge, and the minimum, maximum, and average temperatures over the previous 24-hour period. A daily management report is also sent by email and SMS to select zoo staff. Time snapshots of the data are available remotely on IntelliSensor's secure Web site.
The zoo staff used the temperature and humidity data from the SensiNet temperature nodes to evaluate the thermal performance inside the penguin exhibit to determine if and how it could be improved. Two improvement options were initially considered: installation of additional insulation on the air chiller ductwork, and construction of an isolation barrier.
Figure 4, Phase 1 shows the penguin exhibit's daily minimum and maximum temperatures for a three-week period prior to any modifications. The average minimum temperature was 50.9°F; the average maximum was 53.7°F. These data were used as a basis for comparing the impact of the changes.
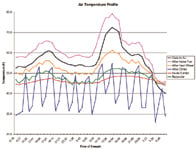 Figure 4. An experimental evaluation of penguin exhibit temperatures yielded daily temperature ranges that proved helpful in deciding on what tweaks the system required |
Performance Tuning at the Exhibit
First, insulation was added to the ductwork of the air chiller that discharges into the penguin exhibit and the temperature and humidity levels were monitored for a two-week period (Figure 4, Phase 2). The results: The average daily minimum temperature was reduced by 1.2°F and the average daily maximum temperature was reduced by 1.5°F.
Next, it was noted that a large volume of air above the penguin exhibit was in contact with the air above another exhibit. A permanent wall was proposed to isolate half of that volume from the penguin enclosure. With construction costs estimated at $5200 and disruption of the exhibit required, a temporary polypropylene barrier was erected instead. While not providing all the thermal isolation of a permanent wall, the temporary barrier does confine the cold air from the air chiller system to the penguin enclosure and allows an assessment of the effect of a permanent wall.
The third phase in Figure 4 shows the effect of the installation of the barrier over a three-week period. The daily average minimum temperature was reduced by 1°F and the daily average maximum temperature was reduced by 1.2°F. Since confining the chilled air to the penguin exhibit did not significantly enhance the thermal performance, it was concluded that the cost of building a permanent wall was not justified.
Performance Evaluation of the Air Chiller
Finally, five additional Sensicast temperature and humidity nodes were temporarily deployed to assess the thermal performance of the air chiller system itself. The chiller is located on the roof ~60 ft. from the data server base station. The existing temperature node measuring outside air temperature and humidity was moved to a shaded area on the roof just upstream of the chiller system intake fan. One SensiNet Mesh Router node was installed inside the air chiller system fuse box. The five temporary nodes were installed as follows:
Node 7. Just after the intake fan
Node 8. Downstream of the enthalpy wheel (air-to-heat exchanger), just upstream of the air chiller heat exchanger
Node 9. Just downstream of the air chiller heat exchanger
Node 10. Placed to measure the temperature of the air returning from the exhibit
Node 11. Downstream of the enthalpy wheel on the return air side
Although all the new temperature nodes were located inside the metal compartments of the air chiller system, this was still a significant distance from the data server base station. The deployment was completed fairly quickly, and reliable communication was established. It would have been almost impossible to have accomplished this ad hoc data collection in a timely fashion with conventional wired sensors.
Temperature/humidity sampling intervals of 1–2 min. were easily set using the Sensi-Mesh software to correspond with the sampling rate inside the exhibit. During the two-day sampling period, the outside air temperature varied from a minimum of 40.2°F to a maximum of 72.5°F. The temperature after the intake fan is typically 4°F–7°F higher than the outside air due to heat from the fan motor in the compartment. The temperature after the enthalpy wheel shows that as the outside temperature increases, the temperature drop across the wheel increases. The exhibit temperature varied from a minimum of 44.3°F to a maximum of 48.6°F.
The most interesting response was shown by the temperature in the compartment just downstream of the air chiller heat exchanger. The exchanger is divided into an upper and a lower section. For two hours, airflow doors are opened to the upper heat exchanger and coolant flows to chill the air through the upper heat exchanger. Then the upper airflow doors close, the lower airflow doors open, and coolant flows to chill the air through the lower heat exchanger. This process precludes the buildup of ice during periods of high humidity.
This led to the examination of the detailed data collected every two minutes. Temperature readings from the temperature node indicated that for two hours the temperature of air around the wireless sensor was ~30°F lower than the reading in the upstream compartment when the upper chiller airflow doors were open. However, during the next two-hour period, when the lower compartment airflow doors were open, the temperature at the node was only ~12°F lower than the reading in the upstream compartment.
System Benefits
The ease and flexibility in the deployment of the intelligent wireless sensor network delivered tangible benefits in monitoring the exhibit temperatures and a better understanding of the thermal performance of the penguin exhibit. This in turn allowed those in charge of the exhibit to avoid the cost of unnecessary construction and disruption.
The ad hoc assessment of the air chiller system's performance is an example of where the SensiNet wireless sensor network has clear advantages both in cost and flexibility over conventional wired solutions.
Sensicast, SensiNet, and SensiMesh are registered trademarks of Sensicast Systems Inc., www.sensicast.com. NiteWATCHMAN is a trademark of XeC IntelliSensor.
Dirk Kalp, MS, and Walter D. Tauche, MS, can be reached at XeC IntelliSensor, Pittsburgh, PA; 724-864-9039, [email protected] (Kalp), 724-309-5410, [email protected] (Tauche), www.sensormgmt.com.