
Heat exchangers (HXs) are devices used to transfer heat from one fluid to another. Most commonly, HXs are constructed of hundreds to thousands of tubes in parallel, encased in a metal shell. One fluid is found inside the tubes, and another fluid on the outside, enclosed by the shell. A very common example for the use of HXs is in fossil-fueled power plants, where they cool and condense steam (on the shell side) by pumping cooling water, such as sea, lake, or river water, through the tubes. Another example is geothermal power plants, where naturally heated water is pumped from the ground and then passed through a HX to heat an organic compound such as isobutane. The isobutane drives the electricity-generating turbines and is then condensed in a second HX. The second HX most often has finned tubes which are air-cooled using large fans. In general, HXs are found in a large variety of industries such as power plants, refineries, paper mills, HVAC, food and beverage, and chemical. Depending on the application, many different types of fluids are used in the HXs; some of these fluids are corrosive to various degrees.
Operating 24/7 over long periods, HXs are subject to eventual degradation or failure through many mechanisms, including erosion, corrosion, abrasion (caused by support plates rubbing against the tubes), thermal shock, sedimentation, and fouling. Plant operators are aware of these inevitable issues and thus inspect their HXs periodically, both to ensure their efficiency and to prevent catastrophic failures.
Inspection of HXs usually requires stopping production in an entire plant, which is costly. Such stoppages, called turnarounds, are often used to carry out maintenance across the plant in addition to HXs, with conflicting requirements of carrying out as thorough an inspection as possible, in as short a time as possible. This conflict is usually resolved through "sampling," a process that examines a certain representative portion of the tubes in any given HX. The portion is typically 8%–10% of the total number of tubes in the HX, though this figure can vary depending on several factors such as cost of inspection, cost of failure, and tube condition. This is a problematic compromise, because leaving a single tube with a bad defect untested can later cause a catastrophic failure, rendering the entire inspection useless.
This article discusses the current methods used to examine HX tubes and introduces the AcousticEye Dolphin system that uses acoustic pulse reflectometry to examine tubes comprehensively and quickly.
Heat Exchanger Maintenance and Typical Faults
HXs have been used for many years, and an entire industry has risen around their maintenance, inspection, and repair. During a typical turnaround, HXs are first cleaned to remove sediments, deposits, and corrosion. This can be a difficult process because some types of deposits are hard to remove and a large number of tubes must be cleaned in a short time. Following cleaning, the individual tubes are inspected. Tubes identified as faulty are then plugged, since HXs have a degree of built-in redundancy, and can therefore function satisfactorily even with a certain percentage (up to about 10%) of its tubes plugged.
The most basic fault that can be found in HXs is fouling, which may not be catastrophic but can considerably impair the efficiency of the HX. Fouling is addressed during the cleaning process, although different methods of cleaning can yield different results. Scale, for example, is particularly difficult to remove. One interesting method of removing scale entails shooting darts through the tubes to first score the scale and then to scrape it out.
Two additional types of faults are the main concern of operators: leaks and wall loss. Leaks—though rare—can impair a HX's functioning seriously, if not catastrophically. Happily, tubes with advanced wall loss can usually be identified and plugged before they develop leaks. Wall loss is commonly measured as a percentage of wall thickness and can be caused by different mechanisms, causing different fault morphologies. Erosion, for instance, might cause gradual thinning over a large part of the tube circumference, whereas localized corrosion could create small, deep pits.
Current Inspection Methods
Over the decades that HXs have been in use, several different inspection methods have gained popularity. These methods are part of the field known as Nondestructive Testing (NDT). The most well known method is eddy current testing (ET) where a probe is physically pushed through each tube and pulled back. The probe contains one or several coils, whose electrical impedance is affected by the surrounding tube. Different configurations of coils and driving frequencies can be used to detect various flaws and to distinguish whether they are on the external or internal surface of the tubes. While ET is relatively accurate, it can be used only on nonferrous metals such as brass or copper-nickel. Several different variants of ET are available for ferrous metals, although they are all slower and less accurate than classic ET.
Another well-known NDT method is based on ultrasound in which a wave is sent through a medium and any reflections caused by discontinuities in the medium are recorded. Adapting this method to tube inspection is quite involved: a probe is sent down the tube; the probe emits an ultrasonic beam parallel to the tube axis that then hits a spinning 45° mirror. As the probe moves down the tube it scans the tube wall in a spiral. This method is known as internal rotating inspection system (IRIS). When using IRIS, the tubes to be inspected must be filled with water, which acts as a coupling medium, similar to the coupling gel used by a physician when carrying out a medical ultrasound examination.
Problems with Current Methods
Ideal NDT methods—fast, accurate, independent of tube material, and completely objective—are very hard to come by, and HX inspection is no exception. The different methods listed earlier score differently on each of the above points but none of them are perfect.
ET and variants. Basic ET is relatively accurate, with the ability to inspect from 30–60 tubes per hour, depending somewhat on their length and condition. Deposits in the tube can cause probes to become stuck, which can hold up the inspection and even damage probes. ET is also heavily dependent on the tube wall material, which is a twofold limitation: it cannot be used to inspect ferromagnetic materials at all, and requires a calibration standard (segments of tubing with carefully manufactured faults, used to calibrate ET equipment before every inspection) for any tube it can be used on. Because a different calibration standard has to be used for every type of material, tube diameter, and wall thickness, ET users have to stock tens to hundreds of such standards, at a very high cost.
ET variants such as full/partial saturation eddy current (FSEC/PSEC), remote field testing (RFT), and magnetic flux leakage testing (MFLT) have further drawbacks. Although they can be used for ferromagnetic materials, these methods are generally slower than ET and less accurate.
Finally, ET results depend heavily on subjective interpretation by the technician. A study conducted by MTI and EPRI, for example, showed that a skilled technician detected 87% of the faults in a HX mockup, whereas another technician detected only 50% of the faults on the same tubes.
IRIS. IRIS, though in some cases accurate, has other problems. The need for good resolution dictates a narrow ultrasonic beam, which in turn entails a very slow pull rate to ensure that the spiral scan of the tube provides full coverage. Filling the tubes with water without air bubbles is messy and time-consuming. IRIS also requires that the tubes be cleaned down to the metal, which is another time-consuming and costly procedure that must take place before inspection even begins. Finally, the accuracy of IRIS decreases as the tube walls get thinner, and it cannot be used on tubes with a wall thickness of <0.9 mm. The same MTI report quoted earlier showed that in certain cases IRIS detected <30% of the flaws in an EPRI heat exchanger mockup with known faults.
APR—A New Approach
Given the drawbacks of existing methods, today it is rare to find plants in which 100% of HX tubes are regularly inspected, leaving room for critical failures. Therefore it is not surprising that engineers are constantly searching to improve on these methods, especially concerning the inspection/analysis speed. AcousticEye has recently brought to the market one such promising technology based on acoustic pulse reflectometry (APR). While APR has been used in academic research labs for several decades, it has only recently emerged as a usable industrial tool. So how does it work?
APR basics. Imagine an acoustic pulse traveling through the air enclosed within a long tube. As long as the pulse does not encounter any changes in the tube cross section, the pulse continues to propagate, with some attenuation due mainly to friction between the molecules of air and the tube wall. If a discontinuity is encountered, reflected waves are created, which propagate back up the tube. The more abrupt the changes in cross section, the stronger these reflections will be. Recording and analyzing these reflections to determine what kind of discontinuity caused them enables this technique to be applied to tube inspection.
What's in a reflection? From the point of view of a pulse traveling down a tube, three basic changes in cross section can occur: a reduction in cross section caused, for example, by some kind of blockage; an increase in cross section, caused by wall loss or bulges; and a through hole. Importantly, the reflections caused by these three cross-section alterations are very different from each other. Figure 1 shows a schematic representation of the reflections caused by each kind of fault. Clearly, the reflection from an increase in cross section is very different from a reflection from a decrease in cross section, and both are different from the reflection caused by a hole. These reflections can be referred to as the signatures of the different types of faults. The signatures in Figure 1 are oversimplified, whereas Figure 2 shows some actual lab measurements. Real-life signals are noisier and less uniform than theory might lead us to believe, although the main features shown in Figure 1 are found in Figure 2 as well. The acoustic pulse acts essentially as a virtual probe; it travels up the tube and returns signals that report on the tube's internal condition. It differs, however, in two significant ways: it cannot get stuck and it operates at the speed of sound.
 Figure 1. Various types of faults cause different types of reflections |
 Figure 2. Lab measurements comparing reference pulses to fault signatures |
Applying APR—From Science to Technology
There are plenty of obstacles to be overcome when translating the general idea we've outlined into an industrial tool. The entire process of creating a pulse and measuring the reflections must be performed in as short a time as possible, in a process that can be repeated reliably many thousands of times. The general block diagram of such a system is outlined in Figure 3. A controller, preferably a computer, creates a pulse in software and outputs it to a D/A card, which drives a power amplifier. The amplifier drives a loudspeaker, which creates an acoustic pulse in the tube being inspected. The various waves propagating in the tube are recorded by a microphone, after which they are digitized by an A/D card and stored in the computer. The digital signals must be processed by software to interpret and classify them into various types of faults as well as to quantify them.
 Figure 3. Block diagram of the pulse creation and measurement system |
Each stage in the process presents unique challenges at the hardware and software levels. Addressing them correctly distinguishes a useful tool from just another nice idea.
The fight against noise. The main challenge in applying APR is to get a high signal to noise ratio (SNR), since reflections from small faults can get lost in ever-present background noise. The stronger the initial pulse, the stronger the reflections, yet there are limitations as to how strong a pulse can be created. The output voltage of the amplifier cannot be increased beyond practical limits, and even if it could, loudspeakers are limited with respect to the maximum voltage that can be used to drive them. In fact, long before dangerous power levels are achieved, most loudspeakers begin to distort the signal until it becomes unusable. One approach to increasing SNR is to conduct the same measurement hundreds or even thousands of times, and average the results. This strengthens the signal while averaging out the noise. However, this process is unacceptably time-consuming.
An evolution of this method is to use pseudonoise. By sending a seemingly random but carefully crafted signal, we can obtain the same effect but in a far shorter period of time. One such signal is known as the maximum length sequence (MLS), used also in measurements of room acoustics. When every component, including the amplifier, loudspeaker, microphone, and A/D and D/A circuitry is carefully selected, we can achieve very high SNR levels—up to 120 dB.
Good reflections vs. bad: calibration. Any practical tool that has to fit a range of tube sizes and configurations must have fittings and adapters that, by necessity, create discontinuities in the system. These create reflections that are spurious, in the sense that they do not represent faults. The larger the discontinuities, the stronger these spurious reflections, which can easily mask reflections caused by small faults. The best way to overcome these is to carry out a calibration measurement on a good tube and then subtract this measurement from measurements taken on the inspected tubes. However, when inspecting a 20-year-old HX, it is rare to find a representative tube in pristine condition. A viable and innovative alternative developed by AcousticEye is to carry out measurements on a large number of tubes, and average these measurements to obtain a form of virtual calibration measurement. In practice this approach works well and, in addition, the standard deviation of these measurements gives an idea of the level of background noise. This can give a "noise sleeve" (as shown in Figure 4), with the upper and lower thresholds indicating that any fluctuations within this sleeve represent noise, while fluctuations beyond it signify a fault.
 Figure 4. Everything between the upper and lower bounds of the "noise sleeve" represents noise while signals extending beyond the sleeve signify faults |
Analyzing the signals. Obtaining clean measurements is one part of the equation, but analyzing these measurements to find indications of faults is also important. Although in many NDT methods this is left to the technician, human interpretation is slow, error-prone, and highly dependent on the technician's proficiency. Applying APR correctly, the range of known possible faults can be simulated and compared to the actual measurements. With the proper on-screen presentation this can aid the human interpretation process as well as advance towards automatic interpretation, speeding up the analysis by an order of magnitude and turning it into an objective rather than subjective process. This is one of the main thrusts of the AcousticEye system, differentiating it from most other NDT systems. Figure 5 shows an example of thresholds for identifying blockage and wall loss, with a signal that cuts the wall loss threshold by 20%.
 Figure 5. Example thresholds for identifying blockages and tube wall loss |
Streamlining the Technology: Usability
The technology for inspecting a single tube is important in itself. However, a typical HX can contain thousands of tubes; therefore, saving even several seconds on each tube measurement can translate into an overall time savings of several hours over the whole inspection. Also, carrying out the measurements is a tedious and monotonous process, leading to errors in keeping track of the tubes being measured and resulting in discrepancies between the tube numbering described in the final report and the actual tubes measured. Periodically verifying that no such discrepancies are occurring is another factor holding back the inspection. It is therefore crucial that the supporting software that steps the technician through the whole process should be as streamlined and easy to use as possible, giving clear visual indications of what tube needs to be measured next. A segment of a screenshot taken from the AcousticEye software is given in Figure 6, in which the tube ends are clearly marked and numbered on a photo of the HX, with the next tube to be measured highlighted in red. At a glance, the technician can verify that the locations of the probe in the software and on the physical HX are in sync.
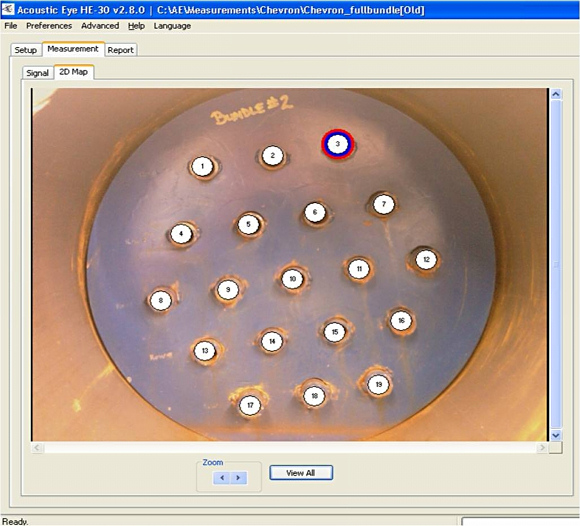 Figure 6. A screenshot showing the various tubes, and identifying the next tube to be checked |
Clean Thy Tubes
Tube cleaning is a painful and somewhat controversial issue in HX inspection and maintenance. Depending on the operating environment, HX tubes can be fouled by a plethora of mechanisms, such as various forms of sludge, sediments and deposits, scale, and even shellfish. Cleaning out the tubes can be costly, time-consuming, and in some cases quite difficult. The approach to cleaning tubes during turnarounds varies greatly among operators. On the one hand, deposits such as scale create a thermal and physical barrier in the tubes, reducing the overall efficiency of the HX, and therefore it is often in the interest of the operator to clean the tubes. However, this process is often perceived as necessary to the inspection process, rather than for correct operation of the HX. Regardless, the cleaning process is very hard to control; up to now, no easy method existed for comparing tube condition before and after cleaning.
APR, in contrast to the other technologies, does not require tubes to be cleaned before they are measured. Measuring a dirty tube will simply give strong indications of partial blockages along the tube, which then can be compared to measurements taken after cleaning. Figure 7 presents an example of such a comparison, showing the effectiveness of the cleaning. Thus, APR is a viable tool for quality control of tube cleaning in addition to detecting defects.
 Figure 7. Comparison of measurement results for tube before cleaning (upper graph) and after cleaning (lower graph) |
Summary
Worldwide, companies involved in many different industries are adopting APR for HX tube inspection. The AcousticEye Dolphin inspection system, using the company's proprietary APR technology, offers ease of use, tube measurements in as little as 9 s per tube, and objective accuracy. This means that companies no longer need to accept the risks that come with sampling.
There are billions of tubes and pipes throughout the world that require effective inspection to ensure safety, efficiency, and reliability, and until now it has been nearly impossible to achieve 100% inspection coverage. As APR's potential is applied to efficiently and effectively examining a larger variety of types of tubes and pipes, we expect that companies will be able to prevent many critical failures and avoid serious catastrophes by performing comprehensive inspection and maintenance that has not previously been possible.
ABOUT THE AUTHOR
Dr. Noam Amir is CTO of AcousticEye Inc., Santa Clara, CA. He can be reached at 888-874-4779, [email protected].