
Ultrasonic cleaning systems are increasingly used throughout the various manufacturing industries for dispersion, surface preparation and degreasing. They are also widely used in healthcare applications, including dental and surgical instrument cleaning. The cleaning process as well as the rapidly-growing fields of sonochemistry and sonoprocessing are both driven by the phenomenon of inertial acoustic cavitation, described briefly as the inception, growth, oscillation, and collapse of gas or vapor-filled bubbles within a fluid driven by a sound field (Figure 1).
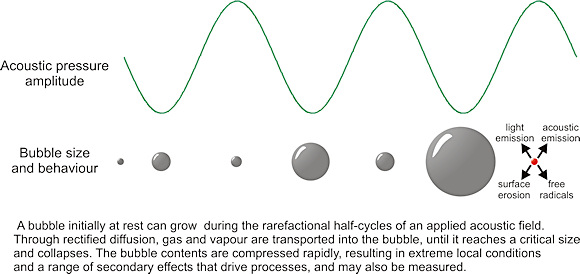 Figure 1. Bubble size and behavior in response to acoustic pressure |
The detectable secondary effects of cavitation are extraordinary; it is estimated that the temperatures inside a collapsing bubble may reach 15,000 K, with pressures in excess of 1000 atm. The microjets generated during asymmetric bubble collapse close to a solid surface may reach speeds of Mach 1, impacting the surface with pressures of 1000 MPa. These extreme secondary effects produce chemical changes, acoustic signals, light emission, free-radical generation, and surface erosion, all of which occur readily in ultrasound applications and can be measured.
The long-standing requirement to develop real-time measurement methods for quantifying acoustic cavitation has been driven by the needs of users and manufacturers. This need is strengthened in safety-critical applications, such as pharmaceutical manufacturing, where ultrasonic systems are used to generate specific particle size ranges and the cleaning of surgical instruments, where it is vital to ensure that the ultrasonic cleaning vessel cleans effectively throughout as much of its volume as possible. To date, no measurement techniques have been found suitable for standardization, and the best way of assessing cavitation in a cleaning system or sonochemical reactor remains the use of aluminum foils, which can record the occurrence of cavitation through surface indentations and the erosion of the material.
There are many reasons for this absence of traceable measurement methods: cavitation depends strongly on the fluid properties, and specifically on the availability of sites for cavitation nucleation, such as trapped air pockets on dust particles; it is therefore a stochastic phenomenon. Cavitation is a destructive process, so any measurement devices must be rugged enough to withstand hostile conditions, yet refined enough to extract useful measurement information. Cavitation may also be interpreted in different ways across applications; it may be either a process requirement or a barrier to success.
Cavitation Sensor
Among the secondary effects shown in Figure 1, the approach adopted at the U.K.'s National Physical Laboratory (NPL) for cavitation characterization is to detect the acoustic signals emitted by shockwaves that are generated during the collapse of bubble clouds. These acoustic signals have broadband characteristics—cavitation is a highly nonlinear process as the applied acoustical field increases in amplitude. The availability of wideband piezoelectric polymers, alongside impedance-matched acoustical absorbers, has allowed us to create passive sensors that are spatially sensitive and minimally perturbing to the field under test. The CaviSensor, conceptualized, manufactured, and tested through Strategic Research at NPL, is shown in Figure 2. It consists of an open-ended, hollow, right-circular cylinder that is 34 mm high, 28 mm i.d., 40 mm o.d., and has a polyurethane rubber construction to minimize perturbation. A 110 µm thick polyvinylidene fluoride (PVDF) layer on the inner wall acts as the sensing element, providing a passive detection bandwidth beyond 10 MHz. The sensing layer is protected from erosion by a ruggedized inner layer.
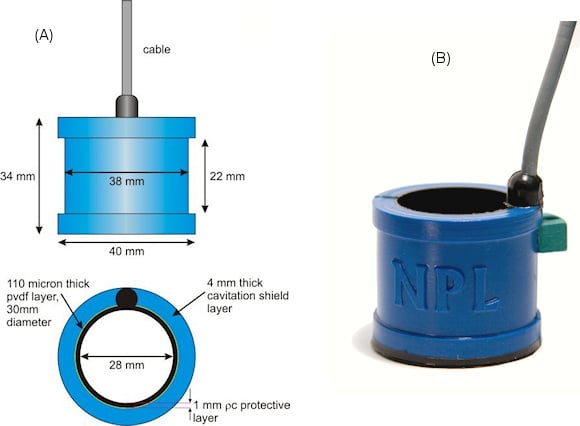 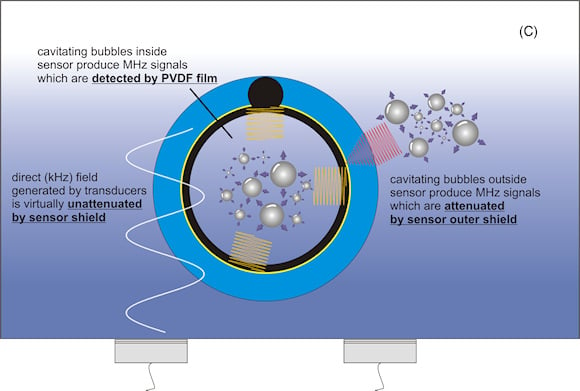 Figure 2.Schematic (A) and photograph (B) of sensor construction, and a diagram of the operational concept (C) |
In use, the CaviSensor is submerged vertically in the liquid medium under test, which then fills the hollow cylinder. The PVDF layer senses acoustic signals generated by the source transducers, and also from the cavitation occurring within the fluid volume enclosed by the cylinder. The PVDF is bonded to a 4 mm thick polyurethane-based rubber material that forms a rigid outer coating for the sensor and which is highly attenuating at MHz acoustic frequencies, such that signals >1.5 MHz must originate from collapsing bubbles and bubble clouds inside the hollow sensor cavity. The outer coating therefore acts as a 'cavitation barrier,' shielding the inner PVDF film from acoustic signals originating from cavitation that is occurring throughout the remainder of the fluid system under test.
Cleaning system and sonoprocessor driving fields typically operating in the 20–200 kHz range yield acoustic emissions from bubbles well into the megahertz range. Because the CaviSensor's outer material strongly attenuates these signals at high frequencies, when the CaviSensor is connected to appropriate monitoring electronics it produces a signal that corresponds to the high-frequency white noise emitted by cavitation activity in a specific region of fluid, thereby endowing the sensor with spatial resolution.
Detection Electronics
Acoustic emissions from cavitation contain a wealth of information about the dynamics of the cavitation process. Because we are using a low-Q sensor, we have developed broad bandwidth instrumentation designed to process and display information in discrete channels, much as would be provided by spectral analysis, but realized in a portable benchtop unit. It provides numerical displays indicative of the low-frequency band corresponding to the direct field and of the high-pass frequency band corresponding to the white noise emitted by collapse cavitation, accompanied by a visual indicator.
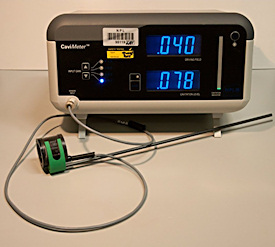 Figure 3. The NPL CaviMeter and CaviSensor |
Any new measurement method and device requires extensive testing to develop confidence in the results it delivers, and examples of two such studies—examining the cavitation produced by commercial cleaning vessels and by sonoprocessors, respectively—are described below.
Ultrasonic cleaning. The first system used for study was a prototype Olympus cleaning vessel, similar to systems used to sterilize surgical devices such as endoscopes. The vessel was 330 mm high by 300 mm wide by 130 mm deep, had four transducers operating at 40 kHz, and used a sweep system to vary the frequency over a +3, –2 kHz range. To maintain stability in fluid temperature and gas content, most measurements were carried out at a drive level corresponding to an output power of 140 W.
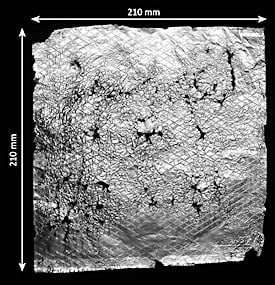 Figure 4. Two-dimensional variation in inertial cavitation estimated by aluminum foil placed in the 40 kHz vessel |
The photograph in Figure 4 shows the erosion patterns produced by the whole cleaning vessel when using a horizontally mounted 210 mm by 210 mm piece of BacoFoil designed to cover all four transducers.
The foil was positioned 9 mm below the water surface and left for 30 s at the operating power of 140 W. The approximate positioning of the four transducers is clearly identifiable through the areas of greater erosion, and overlap regions between the transducers are also distinguishable.
The map in Figure 5 shows a two-dimensional CaviSensor scan of the entire vessel, with data acquired at 10 mm intervals and an average water temperature of 31°C. The structure of the four transducers is again clearly seen, with transducer B generating the strongest cavitation activity and transducer C the weakest. Comparing the two techniques shows a good correlation between the spatial variation of cavitation determined using the CaviSensor and erosion tests carried out using thin aluminum foils, confirming other literature findings. In both cases we can clearly see the expected peak activity locations over the transducers as well as discern more subtle structures that are due to interference effects between transducers.
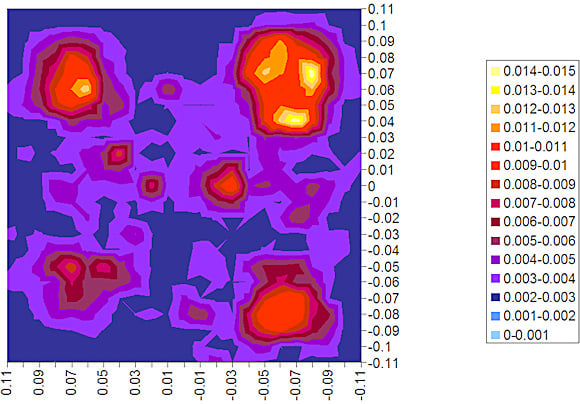 Figure 5. Two-dimensional variation in inertial cavitation as determined by scanning the cavitation sensor throughout the 40 kHz vessel |
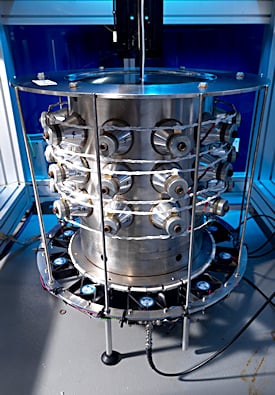 Figure 6. A 25 kHz cylindrical sonoreactor |
A similar system at NPL has an internal diameter of 318 mm, around whose outer surface are positioned thirty 25 kHz transducers arranged in three banks of ten, transmitting into the enclosed volume. The interference between the acoustic fields generated by the transducers, and the vibration modes exploited, yields a highly focused field, with a strong pressure maximum along the central axis of the reactor. By varying the electrical power delivered to the transducers, a variety of acoustic conditions may be generated—not only along the central axis, but also elsewhere within the vessel. The example measurement in Figure 7 shows a comparison between the acoustic pressure and the resulting cavitation, determined across the diameter of the vessel, when a single row of transducers was operating at 20 W. The left graph (Figure 7a) shows the average variation of the peak-negative acoustic pressure with horizontal position across the vessel. This variation was determined using a Reson TC4034 hydrophone.
 Figure 7. Comparison of direct field (a) and cavitation level (b) in a 25 kHz sonoreactor, operating at 20 W input power |
On the right (Figure 7b), the corresponding data set derived with the CaviSensor and CaviMeter is shown, again with the cavitation channel output connected to an external meter, and acquired under PC control. The inset graph for the inertial cavitation activity shows an expansion of the data acquired close to the axis (within ±10 mm) to demonstrate the sharpness of the maximum in the cavitation signal. Only over the central ±5 mm of the main direct field lobe is the acoustic pressure of sufficient magnitude to produce the conditions that generate MHz frequency components, thus indicating the occurrence of inertial cavitation. This result shows the profound difference between the readily measurable direct field in the vessel and the resulting cavitation and clearly demonstrates the need for, and the benefits of, the NPL CaviMeter.
System Availability
The innovative CaviMeter and CaviSensor were the recipients of the Ultrasonic Industry Association Outstanding Product Award for 2009, a prestigious recognition of the capability enabled by the system. The system is commercially available from NPL and has been purchased by users in Europe, Japan, and the U.S. CaviSensors operating over the range 20–60 kHz and 60–150 kHz are available. Discussions are currently at an advanced stage between NPL and manufacturing and distribution partners for licensing the CaviMeter and CaviSensor technology worldwide.
ABOUT THE AUTHOR
Mark Hodnett is a Senior Research Scientist at the U.K. National Physical Laboratory, Teddington, U.K. He can be reached at +44 208-943-6365, [email protected].