
Dennis Teague, a field service engineer with Rockwell Automation, stopped by the Fluke booth at a recent trade show. He had a tough challenge: He needed a way to display the results of fine-tuning a high-response robotic positioning system used to cut product to length in the metals, paper converting, and plastics industries.
 |
In the box-board industry, an 8–9 ft. wide web of continuous corrugated board moves at speeds up to 850 fpm. The web is slit and creased at several widths, then cut to length by two or three rotary shears to yield blanks of two or three different sizes. The blanks are expected to be accurate within ±0.01 in. With cut lengths usually 18–80 in., the repeat cycle for each cut is ~0.25–0.75 s.
Because the knife blades must be line speed matched, and the system at zero position error for ~5 in. of product travel during each cut, position error and torque feedback signals must be carefully examined as the blades settle back at line speed and just begin to enter the cut zone. Achieving this can require capturing ~60 ms of data for each 250–750 ms cut cycle.
For fine-tuning, Teague needed at least two captures on the screen simultaneously for comparison. One, in the foreground, would be a real-time image of the current cycle; the other, in the background, would show data from the previous cycle. Even better would be a third waveform representing the ideal he was aiming for. The scheme would essentially be an updated version of classical oscilloscopes, whose displays could be adjusted such that a burned-in trace lingered long enough to be visible under a new one.
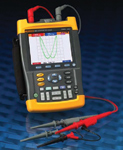
Al Feldman, a Fluke field representative, met with Teague and recommended the ScopeMeter 190C, a full-function portable scope with the power and speed of a 2.5 Gsps bench instrument. It can trigger on each new pulse at a fast-time base, and its Digital Persistence mode allows the user to view the previous waveform in the background along with a third waveform for reference. A 5000-count digital multimeter and ability to capture 100 screens help solve intermittent and hard-to-diagnose problems. The full-color display clarifies individual waveforms, particularly large-amplitude types or multiple overlapping traces. Digital Persistence helps locate anomalies and analyze complex dynamic signals by showing the waveforms' amplitude distribution over various time settings by means of multiple intensity levels and user-selectable decay rates. Fast display updates reveal signal changes with 400 ps resolution.
Contact Steve Clark, Fluke Corp., Everett, WA; 425-446-5285, [email protected], www.fluke.com/scopemeters.