

Hear The Buzz
The world of technology often turns on buzzwords, and these days no buzzword is hotter than "Internet of Things," or IoT. The first problem in peeling the IoT onion is in determining just what it means. The IoT, it seems, is a somewhat nebulous concept, with definitions and contexts galore.
Having said that, we know what the term "Internet" implies: connectivity. The "Things" in the IoT span a wide range of devices, including industrial equipment, shipping containers, baby monitors, medical devices, and a plethora of others. What most of these "things" have in common are sensors gathering information about the real world, as well as some degree of intelligence in the form of an embedded processor.
As sensors collect data on parameters such as pressure, weight, humidity, and so on, transfer of the data to the on-board processor and then to a CPU typically relies on some serial-data protocol or other. Given the broad range of extant definitions for the IoT, this seems to be the most common ground when it comes to how test and measurement meshes with the "Internet of the future."
What Does Debug Mean In IoT Terms?
When debugging an IoT communication channel, we want to ensure that messaging is occurring as expected. Today's oscilloscopes, when equipped with the appropriate trigger/decode software for the protocol in use, perform a range of measurement, analysis, and graphing functions with which to examine the signals between say, a temperature sensor and its master CPU.
For instance, an oscilloscope might extract the data from a serial message stream and use its Track functions to plot that data graphically on the oscilloscope's display. In other words, the digital data sent to/from the sensor is converted to an analog waveform, which in turn can be compared to other signals.
With some oscilloscopes, including many Teledyne LeCroy models, extraction of digital data from a serial stream is as simple as using the "Message to Value" measurement parameter. "Message to Value" extracts the digital data values and converts them to analog values. With the oscilloscope's Track function, the user can display a plot of the analog data values over time in an intuitive analog-waveform representation. This capability applies to many measurement scenarios in an IoT context, such as the aforementioned temperature sensor sending data via an I²C or SPI bus, or rotational wheel speed information used by an anti-lock braking system that is transferred over the CAN bus.
In the example shown in Figure 1, CANbus messages convey data regarding a steering wheel's angular speed and absolute angle. This information is displayed in Track waveforms F2 and F3, respectively. The waveforms lend themselves to easy analysis and debug. One may view either or both waveforms in the time domain for further time/delay measurements on the CANbus signals.
x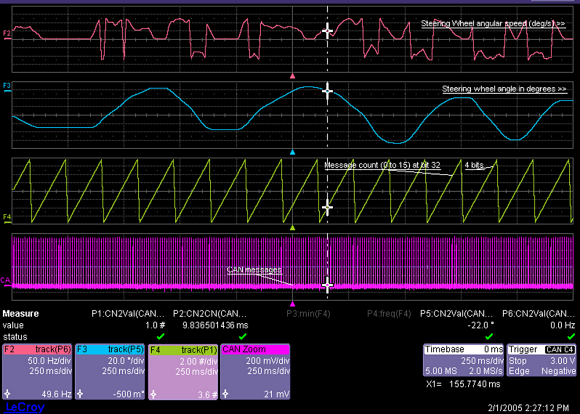 x
x
Fig. 1: In this screen capture, DigRF 3G I and Q data payload fields have been converted into a corresponding I and Q analog waveform representation for analysis and debugging. (Click image for larger version)
Next page
Today's serial-protocol analysis software provides numerous automated measurements of timing and bus status, which are invaluable in cause-effect validation of IoT designs. Some of these functions, such as those found in Teledyne LeCroy's instruments/software, include Message to Analog, Analog to Message, and Message to Message. All of these functions help in rapid assessment and accurate validation of an IoT serial link's operation. One may pass on the results of these analyses to statistical analysis using the oscilloscope's statistical histogram views.
An example of how these analysis functions might help would be a scenario in which a serial data message sent by an embedded controller might initiate another signal or serial data message on the same or another embedded controller. By automating the timing measurement between these two events, and allowing rapid collection and analysis of a large body of timing measurements, it becomes easier to quickly and accurately validate the system and to turn up and debug timing violations.
The following is a brief rundown of what various analysis functions do:
- Analog to Message/Message to Analog: Computes the time difference from a protocol message meeting conditions to the crossing of a threshold on an analog signal
- Time at Message: Time from Trigger to each protocol message meeting conditions
- Message to Message: Computes the time difference from a protocol message meeting conditions to another protocol message meeting conditions
- Data Messages: Computes the time difference between two messages on a single decoded line
Yet another useful set of automated measurements are Bus Status measurements, which give an overall status check on the decode protocol. These measurements determine if the bus is over utilized and verify that the bit rate matches expectations.
The Power Of Conditional Triggering
An important capability of serial trigger/decode software is the ability to specify conditional criteria for data patterns. Conditional triggering lets you isolate and identify specific bus events for quick debugging and verification.
One example might be an IoT application monitoring the output of a temperature sensor. By observing the bus for temperature readings above a specified value, one might verify a design's behavior in over-temperature conditions. In an I²C-based LM75 temperature sensor, for example, the current temperature is read by an I²C bus master, such as a microprocessor, as a 2-byte word. This word contains a temperature reading whose bit length varies from device to device. For the LM75, the temperature reading is a 2's complement value that is 9-bits long.
Let's say we want to trigger our oscilloscope on temperatures above +40°C. As shown in Figure 2, a temperature value of 40°C would be represented by the 9-bit value 001010000, which maps to the 2-byte word 0x2800. The highest positive temperature value that can be represented in 2's complement form is 011111111, which corresponds to the word 0x7F80. So any temperature value higher than 40°C will be represented by a word that falls in the range of 0x2800 to 0x7F80.
x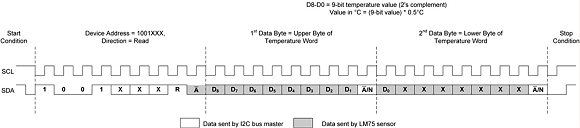 x
x
Fig. 2: Shown is a diagram of the bus traffic during a read of the current temperature from an LM75 temperature-sensing IC. (Click image for larger version)
Next page
An I²C trigger/decode package enables triggering on these bus values using an ADDR+DATA trigger. The ADDR is set to binary "1001xxx" with a direction of Read to identify the correct I²C device. For the DATA portion of the trigger, this condition can be identified using an INRANGE trigger with a lower bound of 0x2800 and upper bound of 0x7F80.
The trigger/decode software's Trigger setup interface allows direct input of both addresses and data in either binary or hexadecimal formats. Thus, it's very easy to quickly set up trigger patterns on a touchscreen-equipped oscilloscope without a lot of knob twisting.
Once the correct trigger patterns have been entered, enabling the software's decode options displays the decoded bus traffic. The corresponding address and data patterns will be overlaid onto the clock and data waveforms.
Conclusion
By correctly using a properly equipped oscilloscope and employing the techniques outlined above, among others, it's possible to ensure that the "things" in any given IoT scenario are communicating as designed with their host CPUs.
About the Author
David Maliniak is Technical Marketing Communications Specialist at Teledyne LeCroy. He blogs, creates support documentation, and writes the occasional technical article. Before joining Teledyne LeCroy in 2012, David was Test and Measurement/EDA Technology Editor at Electronic Design Magazine.
Related Stories
Test Considerations for Automotive Sensors
Decoding Manchester-Based Serial-Data Protocols For Sensor-to-Controller Applications