
Accurately tracking changes in corrosion rates is a serious challenge for gas pipeline operators. Pipeline regulators require operators to demonstrate that corrosion rates are as low as 2 mils/yr. or less to ensure safe operation. Should the measured corrosion rate exceed 2 mils/yr., operators are required to take actions to mitigate the corrosion or effect repairs. While many approved technologies (e.g., corrosion coupons and electrical resistance (ER) probes) are available for measuring corrosion, most of these technologies measure the corrosivity of the gas rather than the changes in the pipeline wall. Because these methods infer the rate of corrosion of the pipeline indirectly, the accuracy of the measurements can be influenced by numerous factors.
One solution to this problem, developed by Fiber Optic Systems Technology Inc. (FOX-TEK), combines very sensitive nonintrusive FT fiber-optic wall thickness sensors with networked monitoring instrumentation and a satellite- or cell-based modem. This system allows accurate remote tracking of pipeline corrosion from virtually anywhere.
The system uses FT sensors, which can be thought of as optical strain gauges, and the associated monitoring instrumentation to measure the minute changes in wall thickness caused by corrosion. This system is nonintrusive, making measurements on the outside surface of the pipe. The strain on the outside surface of a pipe or pressure vessel, at a constant pressure and temperature, changes in inverse proportion to any changes in wall thickness. By comparing the measured changes in strain, as recorded by the FT sensor monitor, with geometric information about the equipment, the company can convert the raw data from the sensors into useful parameters including temperature, pressure, bending strain, and wall thinning.
Operating Principle
The sensor's functional principle is the interference of low-coherence light [1, 2]. Sensors are made from conventional single-mode optical fiber; the small diameter flexible fiber allows the sensor to be packaged into configurations that are suitable for monitoring many types of problems, including corrosion and pipe bending.
While other custom configurations and gauge lengths are used in specialty projects, the FT coil sensors (Figure 1) are used in the majority of applications. Total sensor displacements of over ±15 mm are measurable. This dynamic range, combined with the sensor gauge length, defines the strain range (±1500 µε for a 10 m gauge length sensor). Gage length and sensor configuration are selected during the project-planning phase to meet specific project objectives.
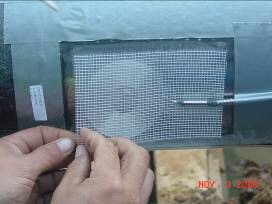 Figure 1. FT coil sensor |
Calculating wall loss due to corrosion in a pipe generally requires strain information from three FT sensors. One sensor, at a location of concern, gives strain information that depends upon the internal pressure, pipe diameter, wall thickness, and surface temperature. The two other sensors provide compensating signals that allow the system to separate out the signal component due to operational variations in temperature and pressure. Once the compensation is done, the strain measured at the area of concern is inversely proportional to the remaining wall thickness (Equation 1):
| (1) |
where:
| ε | = | strain |
| P | = | internal pressure |
| D | = | pipe diameter |
| ν | = | Poisson's ratio |
| E | = | Young's modulus |
| t | = | wall thickness |
Because internal corrosion is an extremely slow process, it is sometimes necessary to collect data over a period of more than 30 days to separate the signal indicating wall loss from background signals.
The sensors' optical signals are demodulated using one of two FT sensor monitors currently available. The FT 3405 is primarily targeted for continuous monitoring applications (Figure 2A) and is AC-powered; the FT 3410 is battery-powered and more compact, suitable for outdoor periodic monitoring applications (Figure 2B).
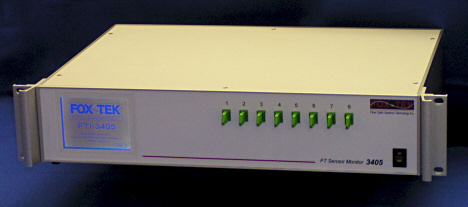 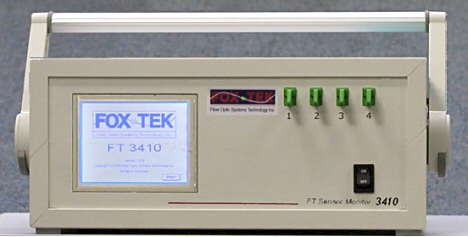 Figure 2. FT 3405 monitor for control rooms (top) and FT 3410 portable monitor (bottom) |
The FT 3405's programmable features allow the company to schedule an automated scanning sequence for all of the attached FT sensors. All data collected from the sensors are stored in nonvolatile memory. These features help reduce labor time, guarantee a continuous consistent stream of reliable data, and allow for more data to be captured.
Multiple 3405 units can be networked together and linked to a single data transmission system, allowing the company to transfer data directly to its Toronto offices on a daily basis and minimizing the number of site visits required.
Sensors in Action
A major gas pipeline operator in the southeastern U.S. was planning to use corrosion coupons to track changes in two pipelines running through a low-lying area, because of an increased probability for corrosion growth. Although one corrosion coupon indicated wall loss rates that were within acceptable limits, the operator wanted to determine the exact wall loss rate through direct measurement.
The two pipelines were uncovered (Figure 3), a process known as daylighting, and FOX-TEK conducted ultrasound scans (Figure 4) at several locations to take a snapshot of the current condition of the pipeline's wall.
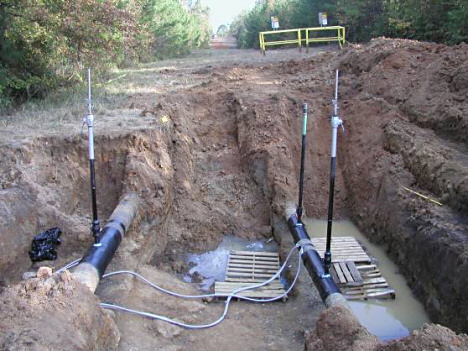 Figure 3. Daylighted gas pipeline site |
 Figure 4. Sample ultrasonic NDT measurement |
 Figure 5. Sensor installation layout (Click image for larger version) Figure 5. Sensor installation layout (Click image for larger version) |
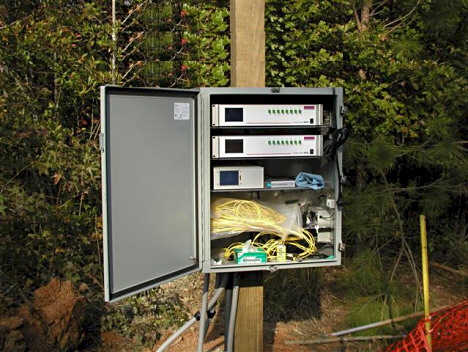 Figure 6. Instrumentation enclosure |
All the data collected from the FT sensor system on the pipeline (Figure 7) are analyzed in the company's DMAT (Database Management and Analysis Tool) program. DMAT is designed to work with FOX-TEK equipment to model real processes and produce reports.
 Figure 7. Data communication schematic |
Due to the nature of the system, pressure within the pipeline fluctuates in a nonuniform pattern. To accommodate these pressure fluctuations, the raw data
 Figure 8. Plot demonstrating the raw and temperature compensated pressure sensors readings (Click image for larger version) Figure 8. Plot demonstrating the raw and temperature compensated pressure sensors readings (Click image for larger version) |
The pressure reference sensors and wall thinning sensors are subject to both mechanical and thermal strain. Models built into DMAT allow the raw signals
 Figure 9. Typical wall thickness vs. time plot for one FT sensor (Click image for larger version) Figure 9. Typical wall thickness vs. time plot for one FT sensor (Click image for larger version) |
When DMAT is used to eliminate the coupling between total strain, pressure, and temperature, FOX-TEK analysts obtain a plot such as the one in Figure 9, which shows the current wall thickness trends based on the analysis for one of the wall-thinning sensors.
 Figure 10. Averaged wall thickness readings (Click image for larger version) Figure 10. Averaged wall thickness readings (Click image for larger version) |
Figure 11
From the four months of collected data, the best linear fit of the current wall loss rate averaged across the sensors is approximately 0.0012 in. per year. Since the sensitivity of the system is 0.002 in., this corrosion rate is lower than the measurable sensitivity of the system.
Applications and Benefits
Technical benefits aside, monitoring corrosion with a FOX-TEK FT sensor system results in tangible cost benefits that include:
- Faster access to corrosion data from difficult-to-access locations
- More reliable data based on direct measurement of the pipe wall in areas of concern
- Better record of inspections through maintaining a secure on-line database
- Reduced inspection-related labor costs
- Greater operating time through accurate end-of-life assessments
- Greater reliability and lower risk
The FOX-TEK system has broad applicability for monitoring corrosion in many types of pipelines and is particularly well suited to tracking generalized wall loss. With the cellular capabilities of the FT sensor monitor and with a remote power supply, FOX-TEK can monitor pipelines in remote locations. This reduces the cost of assembling and sending technical crews out to a remote site while also improving the consistency of information on pipeline integrity.
REFERENCES
1. Morison, W. D., Cherpillod, T., Al-Taie, I., Mutairi, S., "Solving Common Corrosion Problems with Non-Intrusive Fiber Optic Corrosion Monitoring Sensors", Proceedings of the 11th Middle East Corrosion Conference & Exhibition, Bahrain, 2006.
2. Tennyson, R. C., Morison, W. D., Miesner, T., "Pipeline Integrity Assessment Using Fiber Optic Sensors", Proceedings of the ASCE Pipeline 2005 Conference, Houston, TX, Aug 2005, Paper #9149.