

Combining low-cost, spread-spectrum radios with multihop networking, ZigBee addresses a broad set of embedded network applications for home automation, building controls, medical monitoring, industrial automation, automatic meter reading, asset management, homeland security, and other services. Many applications currently being ZigBee-enabled already exist in other forms, often using wired networks or no networking at all.
ZigBee applications are typically built on resource-constrained 8- or 16-bit microcontrollers, with the networking stack and application often sharing the same processor. While developing a ZigBee-enabled thermostat appears to pose debugging challenges similar to those faced when developing a standard microcontroller-based thermostat, sharing the processor between an application and a network stack and the inherent nondeterminism of wireless networking complicate matters. As ZigBee systems grow in size, from a single thermostat to a complete building HVAC system, the applications become more distributed, involving many processors and communications links. This more complicated picture requires a new class of debugging tools. This article surveys traditional embedded application debugging techniques, explores how they apply to ZigBee development, and examines the tools that are emerging to address the situations where they fail.
Debugging a Digital Thermostat
A digital thermostat serves as a good example of how, using traditional debugging techniques, a basic component can be converted to become part of a larger ZigBee system. It also shows where the techniques must be supplemented or replaced.
A typical microcontroller unit (MCU)-based thermostat has an 8-bit MCU with a temperature sensor, an LCD, and some I/O for buttons and the heater control. Once application code is written, a developer typically enters a debugging cycle (Figure 1) that steps through code augmentation/change, reprogramming, and observation. Code augmentation provides better visibility into what is happening in the device. The developer may toggle spare pins to view the program's behavior on a logic analyzer, or else use a spare serial port to print debugging statements. Most modern MCUs also support some sort of in-circuit debugging capability through a JTAG or proprietary interface to allow you to halt and step the processor along and view the contents of memory and registers. These in-circuit debuggers provide a user interface through a PC-based debugging tool.
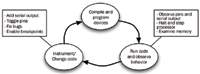 Figure 1. Typical debugging cycle |
A simple ZigBee/wireless version of the same thermostat might separate the temperature sensor component from the controller MCU and allow multiple temperature sensors to communicate to a single controller, perhaps to enable a multizone system. Because each of the remote sensors contains an MCU to drive the radio, the developer is faced with several more MCUs than were present before. The extra components make isolating problems more difficult. For instance, a typical ZigBee device contains a vendor-provided ZigBee stack that interfaces with the radio and shares the MCU's resources with the application code. If a temperature reading fails to appear at the controller, the fault could have occurred at one of many stages: the sensor's application code, the sensor's ZigBee stack, the radio link or network, the controller's ZigBee stack, or the controller's application. The developer requires some level of visibility into the RF communications of the system in order to isolate faults (Figure 2).
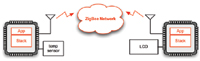 Figure 2. Potential fault errors in ZigBee thermostat system are shown in red |
Packet Sniffers
Enter packet sniffers, one of the most commonly used tools in network development. This tool, typically PC-based, allows developers to see and decode individual packets that go over the air when it is coupled with a radio capable of operating in a promiscuous mode (where the radio can report all packets that it hears, not just those destined for itself). Decoding delivers a human-readable representation of the fields present in each packet along with a time stamp. A developer observing the network traffic with a packet sniffer can often trace a problem to the source, destination device, or the network itself. The presence of the network packets can point to successful operation of the networking stacks in the various devices, and examining packet contents can reveal if the applications are sending the correct data. Once the problem device has been identified via a packet sniffer, developers can use the debugging techniques mentioned earlier, such as serial port printing and in-circuit debuggers, to locate bugs more precisely.
The case of a wireless thermostat highlights a few problems with standard techniques. As the number of sensors and the distance between them increases, obtaining information by toggling pins or serial printing becomes increasingly unwieldy because of cabling logistics and device separation. In-circuit debuggers are often more invasive to ZigBee devices than to non-networked systems; halting the processor by using a debugger while the processor is receiving or transmitting a packet can result in dropping the packet in progress, leading to false information about where a fault is occurring, or introducing new faults.
The packet sniffer also has several limitations. In contrast to wired Ethernet networks—where there is a high correlation between packets the sniffer receives and those received at a network node—in a wireless system packet sniffers may miss packets that are actually present. The sniffer may be out of range of a packet that is received by other devices. Alternatively, the sniffer can receive a packet that isn't received by the ZigBee node being examined. Both of these issues can lead to false reads about the location of a problem. Another concern is the information overload: a single message sent between two ZigBee nodes may involve several packets after acknowledgments and multiple relays are considered. Sifting through these data can be quite difficult, especially when network transactions begin to overlap with each other.
Scaling Up to an HVAC System
The debugging challenges multiply in a larger system, e.g., where the thermostat forms part of a larger ZigBee HVAC system. Most issues are caused by information overload or an inability to collect necessary information because of the system's size.
A ZigBee network covering a large building is likely to have multiple hops between many devices that are communicating with one another. Traditional sniffer tools, which rely on a single data-gathering radio, cannot collect a full picture of the network once the network becomes larger than one hop. Even if the whole network can be heard (by using multiple sniffer devices), correlating which network nodes are hearing which packets becomes much harder. The sheer amount of information arriving at the sniffer can become overwhelming, even when filtering for a single data exchange. From the application's perspective, a single exchange between two communicating devices can involve tens of packets if it traverses a multihop path with acknowledgments at every hop and an end-to-end acknowledgment. A developer may care only about the end-to-end exchange, but the sniffer will show all the intermediate packets that are part of the same transaction, even if the transactions are filtered to show only those involving the source/destination addresses.
Once a ZigBee system is spread over a large area to test behavior in the multihop scenario, it's difficult to use serial port printing and in-circuit debuggers. Running the cables to the devices is impractical, as is situating a computer for debugging near every device. Even if the data from a large number of nodes can be collected, performing rapid analysis on such a large amount of data is challenging. The debugging iteration cycle also lengthens considerably every time a code change is made since reprogramming the large number of devices using traditional tools becomes time-consuming.
Network Analyzers
Network analyzers—some are now available from vendors such as Daintree Networks and Ember—include traditional packet sniffer functionality plus support for multiple data sources and advanced tools to analyze packet activity and minimize information overload. To facilitate data gathering, network analyzers allow several sniffers to be deployed and linked to the analysis PC via Ethernet. This gives developers a single tool to cover a large multihop network. In addition to passive data, Daintree's tool also allows the sniffers to join the network being analyzed and actively collect information by exchanging packets with devices.
These innovative tools surpass packet sniffers due to their data analysis capabilities. Both Daintree's and Ember's analyzers contain features for making sense of the large volumes of data. Both provide visual representations of the nodes present in the network and let developers examine entire transactions instead of individual packets. Using a graphical network representation, the Daintree Sensor Network Analyzer represents multihop transactions through the network with colored curves. Ember's InSight Desktop tool takes a slightly different approach, grouping all the packets in a transaction with one another and displaying these higher-level transactions in a list (Figure 3). Transactions can be grouped into higher-level transactions, and developers can choose to view only the level that interests them. For example, a single packet and its acknowledgment are grouped, while the set of these that makes up a packet traversing the network from nodes A to B would also be grouped. Finally, a return end-to-end acknowledgment through the network from B to A would be grouped with the initial A to B exchange so that the developer could treat all of it as a single event, if desired.
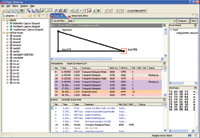 Figure 3. InSight Desktop transaction and packet views. The selection shows three packets collapsed into a single transaction |
Both techniques address information overload from all the raw packets the tools collect. Developers can also extend the tools to understand their application data format and decode it, assisting analysis of packet traffic when using proprietary application protocols on top of ZigBee.
Hardware-Supported ZigBee Debugging
While network analyzers can be vendor independent, creating analyzers to replace traditional in-circuit debug and serial printing functions requires tools to be closely tied to a vendor's hardware. Direct hardware support for network debugging in the MCUs and radios used in ZigBee nodes allows the creation of tools that address many of the limitations of sniffer-based tools, while enabling access to more traditional network debugging techniques. The recent emergence of ZigBee systems-on-chip can make this debugging integration possible. Ember's EM250 system-on-chip, for example, includes a dedicated hardware port (called the InSight Port) that enables several nonintrusive debugging functions in addition to typical in-circuit processor debugging through a standardized 10-pin connector on the circuit board (Figure 4). The functions available through the InSight Port include:
- 1. PacketTrace. This provides a trace of every packet that arrives or departs the chip. It is generated in the radio hardware without processor intervention and addresses the lack of full correlation between the packets heard by the sniffer and those heard by each network device. It gives PC-based tools access to a complete trace of packets as seen by every node in the network.
- 2. API Tracing. This memory-mapped interface can be read through the InSight Port with minimal effect on processor timing, allowing network stack API tracing, and providing greater visibility into the interface between the network stack and an application.
- 3. Virtual UART. An application running on the chip can access this buffer in memory as if it were a serial port or UART, but without any of the timing limitations or interrupts of a hardware UART. Tools connecting to the InSight Port can expose this serial port functionality out to the developer's PC.
- 4. Processor In-Circuit Debug Functionality. This exposes traditional halt/step and memory access type functions.
- 5. Programming. This enables reprogramming of the chip's Flash memory.
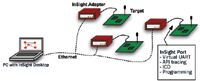 Figure 4. InSight development setup |
This hardware functionality, combined with an InSight Adapter to make the data available to network analyzer software via Ethernet, solves many of the challenges mentioned earlier. Using Ethernet for the adapter allows the system to be scaled up to a greater degree than is possible with USB or serial, both of which are highly constrained by system size.
What's Next?
Emerging ZigBee network analysis tools such as Daintree's Sensor Network Analyzer or Ember's InSight Desktop are evolving to meet the unique needs of large-scale ZigBee application development. Today, this class of tools makes it possible to overcome the limitations of typical embedded software debugging tools as applied to networked systems. ZigBee system-on-chip support for network debugging (currently available on only one vendor's chipset) is sure to spread, allowing more innovation in the development tool arena.
However, several major areas still need to be addressed. Currently, providing processor halt/step debugging functionality in a network is still a challenge. A network-wide safe halt that allows on-air transactions to finish first would be a great step toward this feature. Integration with simulation tools allowing non-hardware-based development can also assist in shortening development cycles. Finally, as the size of networks gets larger, developers will need new methods of presenting and filtering the data collected by these debugging tools.
Andy Wheeler, M Eng , can be reached at Ember Corp., Boston, MA; 617-951-0999, [email protected], www.ember.com.