
Briefly Put
Improving the bias stability of a gyro can be a difficult task as virtually all elements of the gyro contribute to this performance measure. An important part of the operation of the MEMS gyro is accurate control of the sensor’s resonant structure. Two different control configurations are evaluated in this paper with the objective of determining the best configuration for gyro performance and bias stability.
The evaluation compared the expected performance of the sensor and control approaches to the simulation results. A representative sensor was used for the study: a ring-type MEMS gyro. Two control approaches were evaluated: one with only amplitude control of the primary resonance and the other with amplitude and phase control of the resonance.
In comparing the two approaches, it was found that controlling both the phase and amplitude of the primary resonance resulted in a factor of 100 improvement in phase-error suppression over amplitude control alone.
A final evaluation included a test of the MEMS gyro. The results showed that the sensor, with both phase and amplitude control, achieved a factor of two improvement in bias stability. This is a significant improvement in gyro performance.
The MEMs gyro sensor and control electronics
A vibratory gyro measures an external rotation rate by detecting the interaction of the rate with the gyro’s internal resonant structure. The gyro with a ring-type structure has a resonate structure that responds to an external rate in the same fashion as that observed in 1890 by G. H. Bryan with a wine-glass. A standing wave in the glass will rotate a certain fraction of the externally applied rotation.
In the ring-type gyro, the resonant structure includes a primary and secondary mode. The two independent modes are designed to have the same frequency but with mode shapes rotated 45°. The modes shapes are shown in Figure 1 and Figure 2. The primary mode is the main resonate structure.
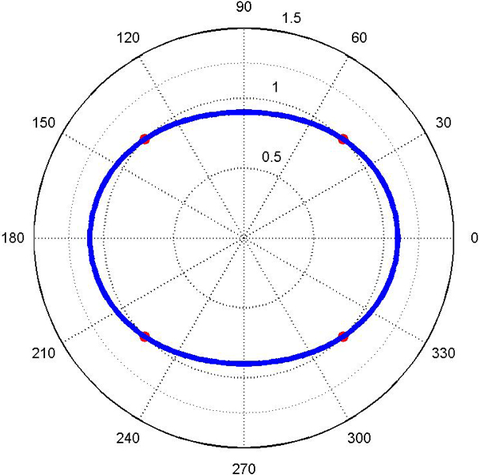
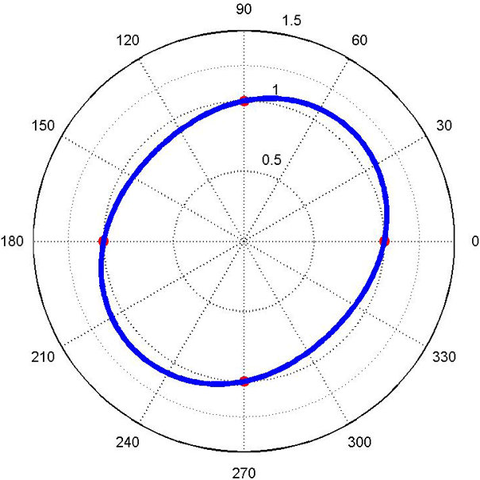
The operation of the gyro involves control of the primary and the secondary resonance structures. See Figure 3 for a block diagram of the sensor and control system. The primary resonance is maintained at a constant amplitude with a control system that detects the amplitude of the primary output signal, PO, and feeds back a primary drive, PD, that keeps the structure at the reference amplitude. The primary control also generates timing signals that are used in the secondary controller.
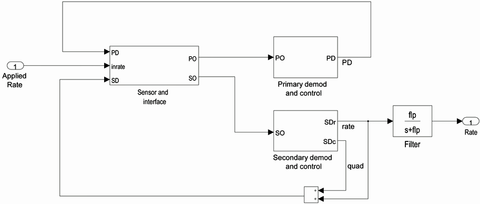
When there is an applied rate, the rotation of the primary will result in a response in the secondary structure. The secondary resonance is also controlled. The control system detects the quadrature and rate components of the secondary output signal, SO. Two feedback voltages are generated: one to control quadrature, SDc, and the other to control the rate response, SDr. The signals are combined to make one signal, SD, that is fed back to the sensor. The design of the control system assures that the amplitude of the feedback voltage will drive the quadrature and rate signals to zero.
Finally, because the rate feedback signal is proportional to the externally applied rate, this signal is split-out and routed to a low-pass filter to provide the gyro output signal, Rate.
Simulation Model
A simulation model of the gyro was constructed to help quantify the sensor performance. The model captures the characteristics of a well-known ring-type MEMs gyro.
The model includes the following features:
- The gyro is fabricated from silicon.
- The frequency, wp, of the primary and secondary resonance modes is 14kHz. The modes are the first two modes of the ring structure.
- The quality factor of the devise, Q, is 5000.
- The sensor is simulated with typical noise density. The noise source is the input referred noise of the sensor interface amplifiers.
- The model includes filters to capture typical effects of implementation.
- The sensor is assumed to have an offset error of 10°/s and a quadrature component of zero. The offset error is then biased to zero (as may be accomplished in calibration).
- The motion of the resonant structure is detected using an inductive approach.
- The simulation was performed using Matlab Simulink.
Detail of Primary Controller
The approach to controlling the primary resonator is to maintain the structure at a constant amplitude at its resonance frequency. This can be done with the self-resonator approach described in Figure 4. The response of the primary structure is detected by the interface gain amplifier, GPO, generating the primary pick off signal, PO. A zero-crossing detector is used to generate the timing signal f0 that is used to demodulate the primary signal and generate the primary amplitude signal, pamp. This signal is filtered and compared to the reference level. The difference is the amplitude error signal, amperr.

The control block then generates a feedback signal, pafb. A second timing signal, f90 that has a 90° phase delay from f0, is used to up-modulate the feedback signal. This primary drive signal, PD with amplitude set by pafb, is then applied back to the resonant structure. This signal will force the amplitude error to zero.
This type of self-resonating configuration may require a start-up circuit. This can be accomplished with an excitation signal, either broad-band or tuned to the resonant frequency, that is applied to the structure at start-up with enough energy that the structure response will initiate the self-resonance.
Phase Error Analysis
While the self-resonating setup is an effective way to control the amplitude of the resonator, it has no detection or control of the phase error. The phase error is the difference in the timing signals f0 and f90 that is not exactly 90°.
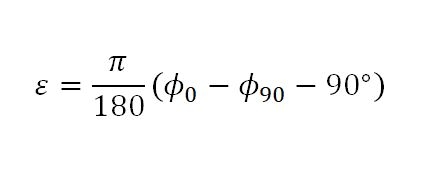
In the primary amplitude control, a phase error will result in an error measuring the primary amplitude. The demodulated primary amplitude will be less than the actual resonator amplitude. The error is proportional to the cosine of the phase error.
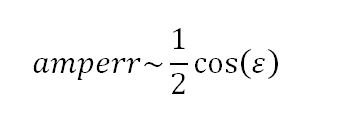

The controller will compensate for the error by applying a higher drive voltage to achieve the reference amplitude. The addition in the required drive voltage is
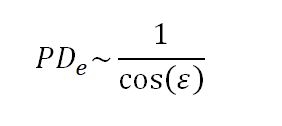

Because the amplitude error is proportional to the cosine of the phase error, it has essentially no sensitivity to small changes in phase.
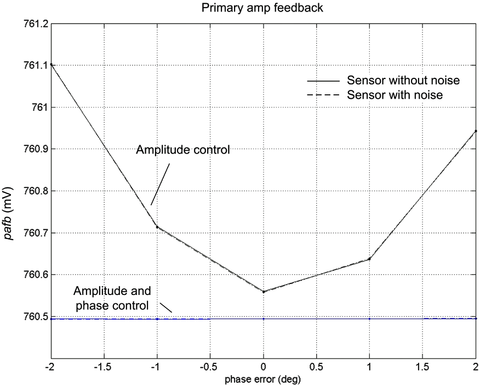
The effect of the phase error was further evaluated using the simulation model. The results are shown in Figure 6 where the drive voltage required to maintain the reference amplitude is plotted against the phase error. The simulation shows that a 2° phase error will result in a 400uV increase in drive voltage for the amplitude only configuration. This is a 0.05% increase.
Although, this small increase in drive voltage and associated error in determining the motor amplitude will generate some error in the scale factor of the gyro, this error is not the most significant effect on the sensor performance. The greater effect is generated when the phase error, by way of the timing signals, is used to process the secondary response.
Addition of a phase detector to the primary control
The primary control system can be modified to capture and control the phase error. The phase control introduces demodulation of the primary with the f90 timing signal. This demodulation is sensitive to phase error. From trigonometry, the error is:
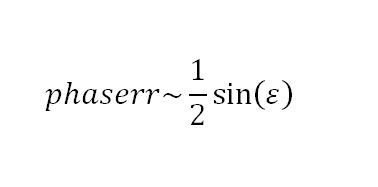

The error signal will be close to a linear function for the expected range of phase error.
The implementation of the phase control is shown in the block diagram in Figure 5. The amplitude demodulation remains in place with the demodulation of the primary signal with the f0 signal. The phase demodulation is added with the demodulation of the primary signal with the f90 signal.
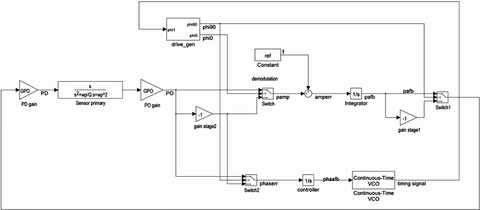
The output of the phase demodulation is the error signal phaserr. The controller then generates the phase feedback signal, phasfb. The phase feedback signal is the input into the voltage controlled oscillator. The VCO block then outputs a clock signal with a frequency that is proportional to the phasfb voltage. This signal goes to the drive generator block and is divided down to create the timing signals, f0 and f90, for demodulation and drive feedback. By the design of the controller, phasfb is the voltage required to drive phaserr to zero.
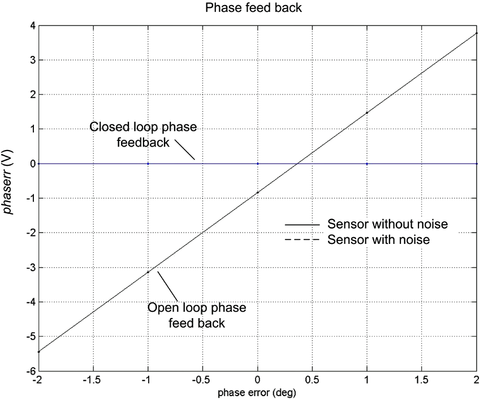
Before closing the loop, a simulation was run to evaluate the open-loop sensitive of the control system to the phase error. The simulation was setup with a fixed phasfb to generate a frequency out of the VCO that matches the frequency of the sensor. The phase error was introduced in the timing signal. (The controller was disconnected.) The output of the phase demodulation, phaserr, was then a measure of the phase error between the resonator and the timing signals. The results are shown in Figure 7. The error is linear, as expected, and has a sensitivity of 1.1V per degree. The phaserr signal is well suited for use in a phase controller.
Performance Of Sensor With Phase Control
With the loop closed, the phase controller effectively drives the phase error to zero in the primary resonance. From the simulation results shown in Figure 6, the feedback amplitude, ampfb, variation with phase error is essentially eliminated. Also, as shown in Figure 7 above, the phase feedback, phasefb, variation with error is also driven near to zero.
As discussed in the previous section, a phase error in the timing signals will generate errors in the demodulation of the secondary resonance. The secondary demodulation is similar to the primary; in this case the f0 signal is used to demodulate the rate component and the f90 signal is used for the quadrature component. Both the rate and quadrature are setup with control loops. Feedback voltages SDr and SDc are applied back to the sensor to drive the rate and quadrature to zero.
Without any control, a phase error will mix the quadrature and rate information. The resulting error in the rate channel, Ratee, can be calculated from:
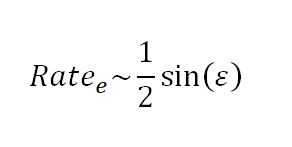

For the example gyro, a 1° phase error would mix in 1.7% of the 10°/s natural offset of the sensor. The expected error is then 315°/hr.
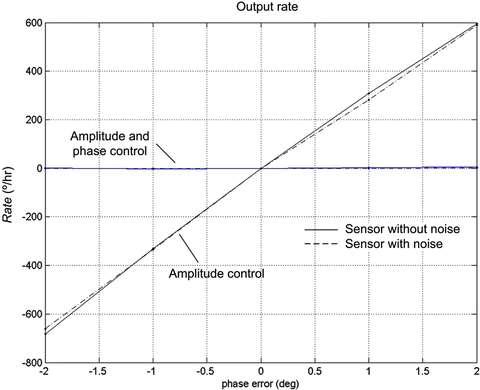
But, this error can be greatly reduced with phase control. The simulation model was used to evaluate the overall effect of the phase error on the sensor performance with and without the phase control. The results are shown in Figure 8. Without the phase controller, the error in the output signal, Rate, is ±300°/hr. (Similar to the expected error.) Conversely, with the phase error controller, the error is ±3°/hr. The gyro sensitivity to phase error is reduced by two orders of magnitude with the use of the phase controller.
The ultimate benefits of the phase control were evaluated by testing an actual MEMs ring-type gyro. The results are shown in the Allan variance plot in Figure 9.
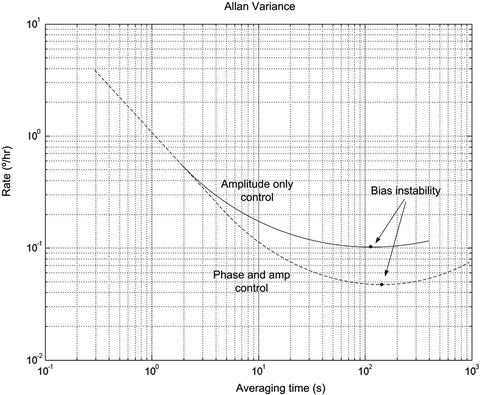
The bias-instability point was improved from 1.0 to 0.45°/hr with the phase control. So, the benefit of the phase controller was found to extend to the actual sensor and to contribute to a significant improvement in bias stability.
About the author
Michael Tracy Ph.D. is the principal at the engineering consulting firm Inertial Sensor Design. He has been leading inertial sensor technology development since developing a MEMS gyro with the Bosh shared-wafer program in 2000. Dr. Tracy has developed gyros for automotive, industrial and aerospace applications. He has also developed IMUs for navigation applications. The author holds a Ph.D. in Aerospace Engineering from Stanford University and can be reached at: [email protected] or 949-350-6272.