
Part 1 of this article was an overview of some of the fundamental acoustical parameters that affect the performance of an ultrasonic sensor. In Part 2 we address radiation patterns and echo variation from targets other than flat surfaces, and the way these parameters can be used to help optimize the selection and operation of ultrasonic sensors for different applications. The figures, equations, and references are numbered sequentially from Part 1.
Radiation Patterns of Transducers and Ultrasonic Sensors
Transducer Beam Patterns. The acoustic radiation pattern, or beam pattern, is the relative sensitivity of a transducer as a function of spatial angle. This pattern is determined by factors such as the frequency of operation and the size, shape, and acoustic phase characteristics of the vibrating surface. The beam patterns of transducers are reciprocal, which means that the beam will be the same whether the transducer is used as a transmitter or as a receiver. It is important to note that the system beam pattern of an ultrasonic sensor is not the same as the beam pattern of its transducer, as will be explained later.
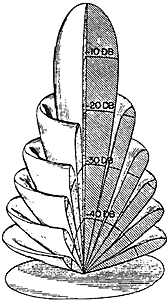
radiating surface whose diameter is
large in comparison to a wavelength
produces a narrow, conical beam
pattern with multiple secondary lobes.
Transducers can be designed to radiate sound in many different types of pattern, from omnidirectional to very narrow beams. For a transducer with a circular radiating surface vibrating in phase, as is most commonly used in ultrasonic sensor applications, the narrowness of the beam pattern is a function of the ratio of the diameter of the radiating surface to the wavelength of sound at the operating frequency, D/λ[8]. The larger the diameter of the transducer as compared to a wavelength of sound, the narrower the sound beam. For example, if the diameter is twice the wavelength, the total beam angle will be ~30°, but if the diameter or frequency is increased so that the ratio becomes 10, the total beam angle will be reduced to ~6°.
For most ultrasonic sensor applications, it is desirable to have a relatively narrow beam pattern to avoid unwanted reflections. The diameter of the transducers is therefore usually large compared to a wavelength.
Figure 7 is a 3D representation of the beam pattern produced by a transducer with a diameter that is large compared to a wavelength. As can be seen, the beam is narrow and conical and has a number of secondary lobes separated by nulls. Each of these secondary lobes is sequentially lower in amplitude than the previous one. (Even though the beam is called conical, it does not have straight sides and a flat top as the word might imply.) The beam angle is usually defined as the measurement of the total angle where the sound pressure level of the main beam has been reduced by 3 dB on both sides of the on-axis peak. However, the transducer still has sensitivity at greater angles, both in the main beam and in the secondary lobes [9]. Figure 8 is a family of curves reproduced from Acoustic Design Charts for transducers with circular radiating pistons mounted in an infinite baffle. The curves show the degrees off axis for the beam angle to be reduced from the on-axis amplitude by 3 dB, 6 dB, 10 dB, and 20 dB as a function of D/λ [10]. Note that the angles on these curves are half of the total beam angle.
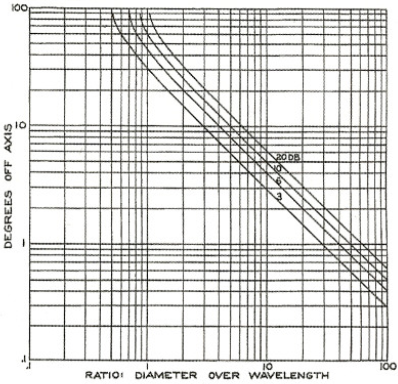
characteristic of circular pistons mounted in an infinite baffle as a function of D/λ.
When describing transducer beam patterns, 2D plots are most commonly used. These show the relative sensitivity of the transducer vs. angle θ in a single plane cut through the 3D beam pattern. For a symmetrical conical pattern such as that shown in Figure 7, a simple 2D plot will describe the entire 3D pattern. Figure 9 shows a 2D polar plot from -90° to +90° of the beam of a circular radiating piston mounted in an infinite baffle with a diameter equal to two wavelengths of sound. As can be seen, the pattern is smooth as a function of angle, and the -3 dB points are at +15° and -15° off axis, producing a total beam angle of 30°. However, the total angle of the major radiating lobe between the first two nulls is ~70°, and the side lobes peak at approximately +55° and -55°. When using an ultrasonic sensor, it is important to be aware that nearby unwanted targets that are beyond the beam angle can inadvertently be detected because the transducers are still sensitive at angles greater than the beam angle. Some transducers used in sensing applications are specially designed to minimize or eliminate the secondary lobes to avoid detecting unwanted targets.
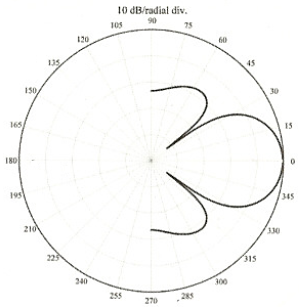
a circular disc radiator mounted in an infinite baffle, where D/λ = 2.
System Beam Patterns. In an echo ranging system, the transmitting transducer sends out sound at reduced amplitudes at different angles, as described by the beam pattern of the transmitting transducer. The receiving transducer has less sensitivity to echoes received at angles off axis, as described by the beam pattern of the receiving transducer. The system beam pattern is the sum in decibels of the transmitter's and the receiver's beam patterns.
The solid curve of Figure 10 is a plot of the beam pattern of Figure 9 on rectilinear coordinates for angles from 0° to 30° off axis. This beam pattern is the same for the transducer whether it is transmitting or receiving. The dashed curve shows the system beam pattern for a sensor using this same transducer to both transmit and receive. As can be seen, the system beam pattern for the ultrasonic sensor is narrower than the pattern of the transducer alone.
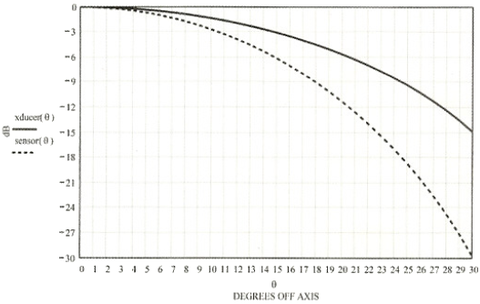
system beam pattern for a sensor using the transducer to both transmit and receive is plotted as the dashed curve.
A target located on the acoustic axis (θ = 0°) will produce an echo that is not reduced in amplitude due to the transmitting beam pattern, and the voltage the echo will cause the receiving transducer to produce will not be diminished due to its beam pattern. If a target is 15° off axis, however, the sound pulse from the transmitter will be reduced by 3 dB due to the beam pattern, which will cause the magnitude of the resulting echo to be reduced by 3 dB. When the echo reaches the receiver, the resulting voltage produced will be reduced by another 3 dB from the voltage that the same magnitude of echo would have produced if it had been received on the acoustic axis of the transducer. Therefore, the 3 dB reduction in echo level plus the 3 dB reduction in receive sensitivity result in a total reduction of 6 dB in the voltage produced by a target 15° off axis as compared to the same target located directly on the acoustic axis.
Targets' Effect on Echoes
The relative echo levels from large flat surfaces where the reflector is larger than the entire incident sound beam was discussed in Part 1 of this article. This type of reflection is typical for an ultrasonic sensor used in applications such as liquid level control. For other types or sizes of targets, though, the echo levels are affected differently. Figure 11 illustrates the behavior of a small sphere as a target. As can be seen, the sphere intercepts only a portion of the sound beam and then reradiates the sound pulse. During this process, the sound pressure is reduced by spreading loss, 20 log (R/R0), as it travels from the sensor to the target. When the sound reradiates from the target, the sound pressure is again reduced by spreading loss as it travels back toward the sensor.
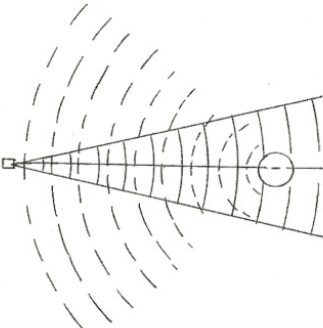
In the case of a reradiating target, the total spreading loss will therefore be 40 log (R/R0), which is the sum of the spreading loss for the sound traveling to the target plus the spreading loss of the reradiated sound returning to the sensor.
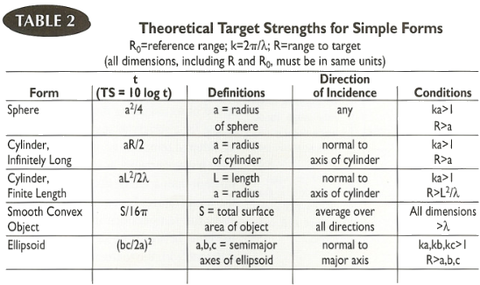
The measure of the reflectivity of a target is called Target Strength (TS) [11]. It is defined as 10 × the logarithm to the base 10 of the intensity of the sound returned by a target at a reference distance from its "acoustic center," divided by the incident intensity of the transmitted sound pulse. The TSs of simple geometric shapes can be theoretically computed; Table 2 contains the expressions of TS for a few types of target forms. When using this table, all dimensional units must be the same, including the reference range, R0, the range distance to the target, R, and all dimensions of the targets.
Such idealized computations of TS should be used only as approximations of real targets, since actual targets are usually not simple reflectors but rather are complex with multiple surfaces of reflection. The sound reflecting from each of these multiple surfaces will produce echoes of different amplitudes that will sum together when they return to the sensor. Since the sound pulse is reflected at different times by the various reflecting surfaces as it propagates across the target, the individual echoes will be different in both amplitude and phase. The total received echo will therefore be a complex summation of these multiple pressure waves of different amplitudes and phases.
Any movement of the target, or any variation in the relative velocity of sound due to air turbulence along the various acoustic path lengths from the different reflecting surfaces of the target, will cause a dramatic change in the TS. The result can be large variations in the echo level produced by a target from one pulse to another during ultrasonic sensor operation. The extent of the variations in TS for a specific target in a given environment can be experimentally determined by measuring the changes in the magnitudes of echoes from the target for a series of pulses at all expected variations of target position and over all expected environmental conditions.
For reradiating targets, the echo level as a function of target range is:
| ELf (R) = SPL(R0) - 40 log (R/R0) - 2αfR + TS | (6) |
where:
| ELf (R) | = echo level at frequency f |
| R | = range distance to target |
| SPL(R0) | = sound pressure level of transmitter at reference distance R0 |
| αf | = attenuation coefficient of sound at frequency f |
| TS | =target strength |
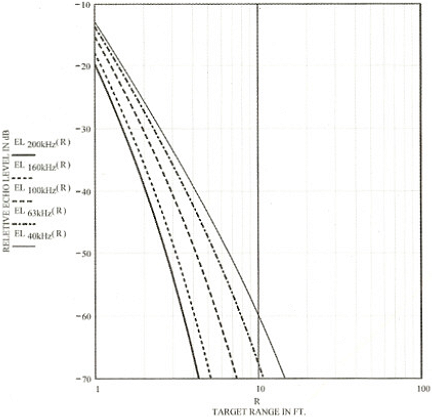
Equation (6) can be used to compute the relative effect that varying the sound frequency will have on echoes produced from reradiating targets at different distances from the sensor. For example, it is assumed that the same sound pressure level is produced by the sensor at all frequencies, and that the same target is placed in line with the acoustic axis of the transducer. For illustration, the target is assumed to be a sphere with a radius equal to 6 in. (1/2 ft). From Table 2, this will result in a TS equal to -12 dB. Figure 12 shows plots of the relative ELf (R) from a reflecting sphere with a 6 in. radius at different distances from sensors operating at different frequencies.
Comparing Figure 12 to Figure 6 in Part 1 shows that there is a considerable reduction in level when an echo from a large flat reflector is compared to an echo from a 6-in.-radius sphere at the same range and frequency. This shows that the maximum range of a sensor can be greatly reduced by different targets.
Selecting and Using Ultrasonic Sensors
When selecting an ultrasonic sensor for a particular application, it is important to consider how the echo will be affected by the acoustical fundamentals. There is a wide variety of sensors available that operate at different frequencies and have different beam angles. In addition, systems can have different electronics options such as temperature sensing and signal averaging. The proper choice of sensor parameters will help optimize the system performance.
Variations in Frequency of Sensors. In general, the lower the frequency of the sensor, the longer the range of detection, while a higher frequency sensor will have greater measurement resolution and less susceptibility to the background noise. The background noise produced under most conditions is lower in amplitude at higher frequencies, and will attenuate more at higher frequencies as it travels toward the sensor. Because most sensors produce relatively narrow beam angles, the physical size of the transducer in the sensors will typically become larger as the frequency decreases.
Absolute Accuracy, Relative Accuracy, and Resolution. The concepts of absolute accuracy, relative accuracy, and resolution are different in ultrasonic sensors. Absolute accuracy is the uncertainty error in the exact distance measurement from the face of the ultrasonic sensor to the target. Relative accuracy is the uncertainty error in the change in distance measurement when the target moves relative to the sensor. Resolution is the minimum change in distance that can be measured by the sensor when the target moves relative to it. These measurements are affected by factors such as the wavelength of the sound, the Q of the transducer, the reflecting characteristics of the target, the operation of the target detection electronics in the sensor, and the uncertainty in the assumed value of the speed of sound.
Uncertainty in accurately knowing the exact speed of sound over the entire transmission path is usually the major contribution to inaccuracy in the absolute measurement of the range to the target. Figure 1 in Part 1 shows the speed of sound in air as a function of temperature based on Equation 1. During operation, the ultrasonic sensor measures the time interval from when the sound pulse is transmitted to when the echo is received, Δt, and computes the target range.
In the vicinity of room temperature, a 1°C change in temperature will produce an uncertainty in sound speed of ~23 ips. This causes an uncertainty error in the accuracy of the absolute distance measurement for a 1°C temperature change of:
| errRin(R) = 0.0017 R | (7a) |
| errRft(R) = 0.0204 R | (7b) |
where:
| errRin(R) | = uncertainty error in target range in inches for a 1°C uncertainty in temperature when target range R is in inches |
| errRft(R) | = uncertainty error in target range in inches for 1°C uncertainty in temperature when target range R is in feet |
Figure 13 plots the uncertainty error in the absolute target range measurement in inches as a function of target range for a 1°C uncertainty in temperature, as computed by Equations (7a) and (7b). The solid curve shows the measurement error if the target range R is in feet; the dashed curve is for target range in inches.
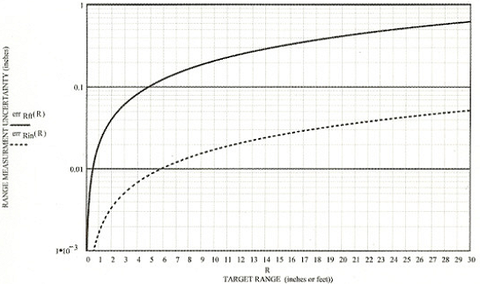
uncertainty in temperature. The solid curve is used if range R is in feet; the dashed curve is used if R is in inches.
Uncertainties in the average value of the speed of sound along the acoustic path can occur for a variety of reasons. A sensor with an internal temperature probe will obviously have less uncertainty in sound speed approximation than a sensor that does not measure the temperature. In some applications, however, the temperature in the transmission medium between sensor and target can be different from the temperature at the sensor, which therefore will cause an error even if a temperature probe is used.
If there is air turbulence along the path from the sensor to the target, then the average speed of sound will randomly change, causing the target range computed by the sensor to randomly vary from pulse to pulse. Similar variations in the arrival time of a target echo will appear if the target surface is moving, such as when a liquid surface contains waves. For these applications, measurement accuracy will increase if the sensor is capable of averaging a number of measurements before providing a target range output.
The uncertainty in sound speed over the acoustic path has much less effect on the sensor's relative accuracy when a change in target range is being measured. For this situation, equation (7a) becomes:
| errRin(ΔR )= 0.0017 ΔR | (8) |
where:
| errRin(ΔR) | = uncertainty error in relative change in target range in inches for a 1°C uncertainty in temperature when target range changes by ΔR inches |
If the temperature is unknown by 5°C, and a target at a range of 100 in. moves 0.500 in. toward the sensor, the error in the absolute target range measurement of 100 in. will be 0.85%, or 0.85 in. However, the error in the relative distance measurement of 0.500 in. will be only 0.004 in.
The resolution of a range measurement made with an ultrasonic sensor is influenced by many factors. Since the sensor is measuring the arrival time of an acoustic pulse, the higher the ultrasonic frequency the greater the resolution because both the wavelength and period of the echo signal are smaller at higher frequencies. The accuracy of the time-measuring circuits in the sensor also affects the resolution, as will the averaging capabilities of a sensor if there is turbulence along the sound path. The best way to measure the true resolution of an ultrasonic sensor for a particular application is to place a target at a fixed distance and obtain a stable range measurement. Then slowly move the target forward or backward until the sensor indicates a measurable change in target range. Accurately measure the distance the target moved. This change in distance is the resolution of the sensor. Compare the actual distance the target moved to the change in range measured by the sensor. This is the error in the resolution of the device.
Target Range Measurement. For each application, it is important to select a sensor that will detect the desired targets when they are located within a specified area in front of the sensor, but ignore all targets outside this area. As previously noted, a lower frequency sensor should be selected for longer ranges of detection and a higher frequency sensor should be used for shorter range, higher resolution measurements. Sensor beam angles should be selected to cover the desired detection geometry, and to reject unwanted targets.
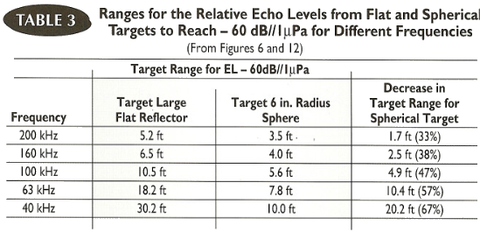
The maximum range at which an ultrasonic sensor can detect a target is affected by attenuation of the sound and the target strength. These effects can be illustrated by using the data in Figure 6 in Part 1 and Figure 12, and setting a minimum echo detection threshold. Table 3 was prepared by arbitrarily choosing for illustration -60 dB//1μPa as the minimum echo level the sensor can detect. It shows that the range at which the echo level reaches -60 dB//1μPa will vary for sensors operating at different frequencies between 40 kHz and 200 kHz for both a large flat target and a 6-in.-radius sphere. These range values are therefore the maximum detection ranges for the sensors and targets used in this illustration.
As can be seen from Table 3, the lower the sound frequency, the longer the detection range. The maximum detection range of a sensor is greatly reduced, however, when the target is spherical rather than a large flat reflector, and the percentage of range reduction is greater for lower frequencies. At 200 kHz, the maximum range between the targets is decreased by 33%, while at 40 kHz the range reduction is 67%.
Humidity can also have a significant effect on the target range. The curves of Figure 6 in Part 1 and Figure 12 use values of attenuation that are greater than the maximum attenuation that would be caused by humidity variations at each frequency. Figure 4 in Part 1 shows that there is a large variation in attenuation at any particular frequency as the humidity varies. For example, at 100 kHz the attenuation varies from 0.5 dB/ft at 0% RH to 1.3 dB/ft at 90% RH. This means that if a target is at a range of 10 ft from the sensor, the echo level will change a total of 16 dB if the humidity changes from 0% to 90%.
Figure 14 shows plots of the relative echo levels from a large flat target that can be obtained with a sensor operating at 100 kHz for humidities of 0% RH and 90% RH. As can be seen, the magnitude of the echoes at each range changes dramatically between the two humidities, so the maximum detectable range of the sensor for a given target will also be greatly affected by humidity. It is therefore possible to successfully install a sensor for a particular application, and at a later date find that it is no longer detecting targets if the humidity changed enough to cause the target echoes to attenuate below the detection threshold of the sensor.
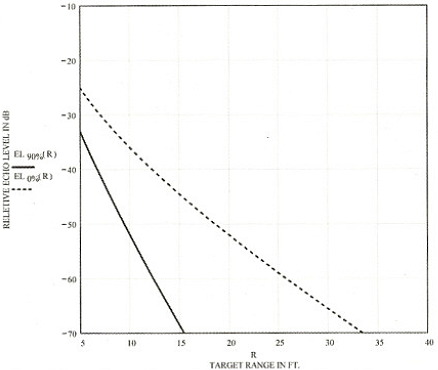
target at varying distances are plotted against a range for 0% and 90% RH.
Effective Beam Angle. It is important to consider an ultrasonic sensor's effective beam angle, which is the angle around the acoustic axis where a target will be detected. If the target moves closer to the sensor, or if a target with a greater TS is used, then the effective beam angle will increase. At only one range for a particular target will the effective beam angle be equal to the classical beam angle that is obtained from the polar radiation pattern. Therefore, the classical beam angle can be used only as a first order guide in determining whether targets will be detected or ignored by the sensor.
At the maximum detection range, the amplitude of the target echo is just barely large enough to be detected by the sensor electronics when the target is directly in line with the transducer's acoustic axis. Reducing the echo level by rotating the target slightly off the beam's acoustic axis will lower the amplitude of the echo below the sensor's detection threshold. Under these operating conditions, the effective beam angle of the sensor will therefore be essentially 0°.
As a target moves closer to the sensor, the echo level increases dramatically. For a sensor operating at 100 kHz and using a large flat plate as a target, the echo level can increase more than 60 dB as the target moves from a range of 10 ft to a range of 1/2 ft. This means that at a range of 1/2 ft, for any angle off the acoustic axis where the sensor beam pattern has not reduced more than 60 dB, the flat target will produce an echo larger than that from the target on axis at a range of 10 ft. For a sensor with a transducer radiation pattern as shown in Figures 9 and 10, a large flat target at a 1/2 ft range would be detected almost continuously as the sensor is rotated ±90°. Some sensors have variable gain amplifiers that lower the detection levels for close targets, and therefore reduce the tendency to widen the effective beam angle of the sensor.
Summary
This two-part article has provided a brief overview of some of the fundamentals that influence the operation of ultrasonic sensors. As was shown, the maximum detection range of an ultrasonic sensor is typically longer for lower frequencies, while the resolution and accuracy are typically better at higher frequencies. The strength of the target echo, however, is greatly affected by the geometry and reflectivity of the target, thereby affecting the range and resolution of the distance measuring system.
One of the biggest sources of error in an ultrasonic position measurement is the variability of sound speed in the transmission path between the sensor and the target, largely caused by uncertainty in the average temperature along the path. Maximum measurement accuracy is therefore obtained when temperature compensation is used within the sensor. Note that temperature uncertainty affects absolute accuracy substantially more than it does the relative accuracy of an incremental measurement.
It is not unusual for the amplitude of echo levels to change by large amounts from pulse to pulse due to variations in sound speed in the medium, caused by factors such as air turbulence or target movement. Also, long-term changes in humidity can have a significant effect on the strength of an echo from a target.
It is usually desirable to use a sensor with the narrowest possible radiation pattern that can detect the required targets. For a greater frequency, the narrower the radiation pattern of the sensor, the longer the maximum range of the sensor and the less susceptibility to unwanted targets at the sides of the sensor. However, a very narrow radiation pattern from a sensor will require more accurate orientation of the sensor's axis with regard to the acoustic beam's perpendicularity to a flat target. In any event, the user must understand the effective beam angle of the sensor when determining which targets will be detected and which will be ignored. This effective beam angle changes with the distance of the target and the strength of the reflection from the target.
References
8. Leo L. Beranek. 1954. Acoustics, McGraw-Hill:91-106.
9. Introduction to Sonar Technology. 1965. Bureau of Ships, Dept. of the Navy, NAVSHIPS 0967-129-3010.
10. Frank Massa. 1942. Acoustic Design Charts, The Blakiston Company:141.
11. Robert J. Urick. Principles of Underwater Sound (3rd Ed.), McGraw-Hill:291-308.
About the author
Donald P. Massa is President of Massa Products Corp., 280 Lincoln St., Hingham, MA 02043-1796; 781-749-4800, fax 781-740-2045, [email protected] or www.massa.com.