

In the pre-dawn quiet on Sept. 4, 2010, New Zealand's second largest city, Christchurch, was struck by a magnitude 7.1 earthquake – with thousands of aftershocks following the quake for the next few months. In particular, a magnitude 6.3 quake on Feb. 22, 2011, resulted in 181 fatalities and wreaked havoc on buildings, city infrastructure and land already weakened by the September quake. Although smaller in magnitude, the February event was shallower and harder, and produced one of the world's highest recordings of peak ground acceleration. Yet another major quake, a magnitude 6.4 on June 13, 2011, significantly set back the city's recovery.
After the June earthquake, engineers divided Christchurch into four zones representing whether repair and rebuilding were viable: green zone – yes; red zone – no; orange zone – need more data; and white zone – not yet mapped. Approximately 9,000 properties comprising the orange zone needed to be quickly surveyed to better determine whether they were "red" or "green." For many of these properties, the main problem was land sinkage resulting from liquefaction – some land had sunk by up to 4.9 feet, making it less able to support construction. Engineers required survey data to understand what would be needed to bring land back above the flood level—and to determine whether it was worthwhile economically to do so.
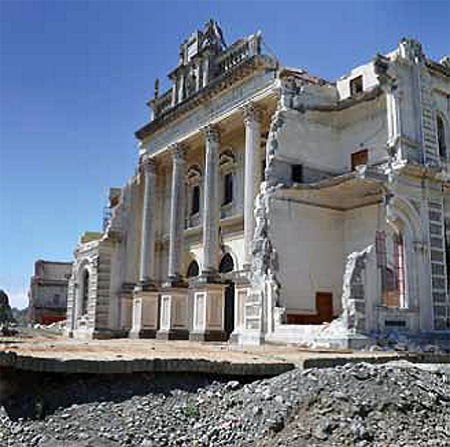
Christchurch after the earthquake.
Several surveying and geotechnical consultants collaborated to assess the orange zones, including Tonkin & Taylor Ltd., geotechnical consultants working for the Canterbury Earthquake Recovery Authority (CERA), and other providers of land survey and resource management services to New Zealand's Otago region. Another New Zealand-based surveying and imaging company provided nine additional surveying systems comprising several advanced satellite tracking platforms and controllers running application-specific imaging software. Reference stations for monitoring data sensors were installed inside and outside the quake zone and provided control; access to the data network was free for all surveyors during the initial recovery period.
Due to the large surveying area, time constraints and number of surveyors from different companies, the project's success relied on all data being consistent. Surveyors and engineers would be relying on not only accurate imaging hardware, but also consistent transmission of data from sensors to processing centers.
"We couldn't afford to have any mistakes," said Paterson Pitts Project Manager Mike Botting. "People's livelihoods and properties were at stake."
To ensure that consistency, GNSS surveying expert Reece Gardner of 3D World in Christchurch defined all surveying procedures for the project. Gardner was also responsible for processing, quality checking and ensuring data completeness.
Up to 20 surveying teams were on the ground each day; at peak demand, the data sharing network reached a record number of concurrent users. Surveyors focused on the vertical movement of each property, taking measurements every 32.8 feet, or 8 to 10 measurements per property. They also measured from the berm and, if possible, the centerline of the street, which typically didn't move as much as the surrounding land. Most points gathered were GNSS measurements, with GLONASS satellites proving especially valuable in areas of tree canopy. The internal modem on the satellite-tracking platform controllers also made data capture easier because no external call phone was required to access the network.
The project was completed in just two weeks due to the streamlined project processes and team efficiency. "It was just basic survey work, but at such a large scale—more than 2,125 acres—that the VRS network and the speed at which we could operate made a significant difference," said Botting. "Teams could go straight to a site and start surveying in a couple of minutes thanks to the network."
Within hours of the February earthquake, Christchurch's central business district was cordoned off behind army barricades as strong aftershocks continued to bring down city buildings. A team of spatial imaging experts ventured into this virtual war zone to capture 3D data of the damaged city.
GeoSystems New Zealand Ltd., paired with outside agencies to utilize mobile spatial imaging sensor systems allowing government agencies responsible for all spatial data to access comprehensive hardware and software tools to best complete the surveying project.
The mobile spatial imaging sensor system was installed on an SUV. A "pod" on the vehicle's roof held two 3D scanners, installed at 270° to each other, and four cameras—three facing forward and one rear-facing. A rack of computers running data capture imaging software was installed where the passenger seat had been. A positioning and orientations system, using its integrated combination of inertial, GNSS and distance measurement technologies utilizing sensor technology, provided precise position and heading information under even the toughest conditions.
With the assistance of New Zealand's Ministry of Civil Defense and Emergency Management, the three-person spatial imaging team gained entry to the central business district after an intensive introduction that included briefings on safety procedures plus hazards such as major aftershocks and sinkholes. Still, the team was in for a shock.
"It was eerie and so surreal," Hewitt said. Although Hewitt is a Christchurch local, with familiar buildings now crumbled it was often difficult for him to determine where he was apart from the GNSS data.
Data capture was completed in just two days using the mobile spatial imaging sensor system, even though debris and other obstacles limited driving speeds to about 12 miles per hour. The data was then post-processed using control data from an earlier surveying project to provide an accurate 3D model of the land and crumbling structures.
To make the central business district safe for rebuilding, numerous damaged buildings were rapidly demolished and cleared. This process eliminated many survey marks, making re-measuring property boundaries extremely difficult. Additionally, the physical boundary of many commercial properties came down to the occupation on the site as the primary definition of the property. When buildings were cleared away, those physical occupations were lost.
In the years following the initial rebuilding efforts, crews began building out sensor networks to enhance monitoring in several key areas. During the earthquake, a major bridge over the Rakaia River was damaged, blocking Lyttleton, a major port, forcing engineers to seek alternative supply routes. Timaru, a port town on the eastern side of the south island, has been designated as a good choice for an alternative to receive supplies and the development of a new pipeline. As a result, this bridge now has 40 sensor control points installed to monitor the structural integrity of both the bridge and surrounding area as a new pipeline is developed. Additionally, several new buildings, including the newly rebuilt Trimble offices in Christchurch, now have GPS sensors installed on the rooftops, 4D sensors in the control systems, and independent seismic monitoring sensors underground to better understand the integrity of the structure in the event of another earthquake.
As cities around the world continue to examine infrastructure and assess resiliency in the face of natural disasters, the implementation of advanced sensor networks will greatly aide in sustainable development. In Christchurch, a strong case study for the use of sensor networks in disaster recovery applications, engineers utilized advanced 3D scanning sensor hardware and imaging software, along with a little ingenuity, and were able to gather a unique 3D model of the central business district accurate to around two inches, ensuring that the rebuilding efforts were undertaken on sound structures and stable ground.
About the Author
Bryn Fosburgh joined Trimble in 1994 as a technical service manager for surveying, mining, and construction. In 1997, Fosburgh was appointed director of development for the Company's land survey business unit where he oversaw the development of field and office software that enabled the interoperability of Trimble survey products. From October 1999 to July 2002, he served as division vice president of survey and infrastructure. From 2002 to 2005, Fosburgh served as vice president and general manager of Trimble's Geomatics and Engineering business area, with responsibility for all the division-level activities associated with survey, construction, and infrastructure solutions. In January 2005, he was appointed vice president and general manager of the Engineering and Construction Division. In October 2007, his role was expanded to include a number of divisions within the construction business, as well as a responsibility for a number of corporate functions and geographical regions.