
Meggitt Sensing Systems in San Juan Capistrano, CA, has developed the Endevco family of lightly damped, mechanically stopped, high-survivability, high-shock accelerometers to complement the legacy Endevco family of silicon-based undamped high-g shock accelerometers that is presently the industry standard.
Available in both 20,000 g and 60,000 g ranges, the new Endevco piezoresistive accelerometer family has light gas damping and mechanical over-travel stops for dramatically enhanced shock survivability to four times its rated range, which is ideal for in applications where actual shock levels may not be known. The mechanical over-travel stops in the damped piezoresistive sensor are set at 2X range minimum on both ranges, which allows for measurement linearity to 1.5X range and minimal zero shift after shock. Additionally, integral electrostatic discharge (ESD) protection is added to protect against damage caused by static electricity. In addition, the proprietary manufacturing processes used at Meggitt's ISO9001-certified silicon fabrication in Sunnyvale, CA, are crucial to the design of a reliable, survivable high-shock accelerometer.
The sensors use squeeze-film damping to obtain the light gas damping employed. Squeeze-film damping is essentially the squeezing and displacing of air as one plate (i.e., the proof mass of the sensing element) moves toward a second fixed plate (i.e., the mechanical stop). The introduction of even a small amount of damping can reduce the amplification factor (or Q) at resonance, which limits the resonant frequency excitation; excessive resonance frequency excitation has been shown to cause permanent damage to undamped accelerometers. As a simple illustration of this principle, consider an undamped sensor with damping of approximately 0.5% critical (or ζ=0.005). The amplification factor of this undamped sensor (ζ=0.005) is roughly 100, meaning the sensor could respond to a 2,000 g shock input as if it were actually 200,000 g. The presence of even 5% damping (ζ=0.05) reduces the amplification factor to 10, meaning a lightly damped accelerometer will respond to the same 2,000 g input as if it were actually 20,000 g, significantly improving the shock survivability.
Because the new damped high-shock accelerometer series is controlled by U.S. International Traffic in Arms Regulations (ITAR), additional details can only be divulged on request to properly vetted persons in industry, academics, or government.
Although both 20,000 g and 60,000 g ranges are currently available, our discussion will focus on the testing performed on the 20,000 g range of sensors. In 2010, the new 20,000 g sensor was tested at both the internal shock test facility at Meggitt Sensing Systems (San Juan Capistrano) and at the Lab at the Fuzes Branch, Munitions Directorate of the Air Force Research Laboratory (AFRL) at Eglin Air Force Base (Eglin AFB) under the direction of Dr. Jason Foley of the U.S. Air Force Research Laboratory and Dr. Alain Beliveau of Applied Research Associates (Figure 1).
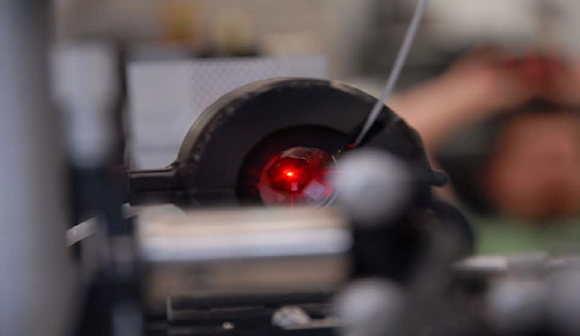 Figure 1. Laser light reflecting off a test fixture containing the new damped high-shock accelerometer |
The primary purpose of the testing was to characterize the sensitivity, offset, linearity, damping, over-range, and survivability performance of the new accelerometer. A secondary aim was to evaluate a new fixture designed by Meggitt Sensing Systems (San Juan Capistrano) for testing high-shock accelerometers housed in surface mount technology (SMT) leadless chip carrier (LCC) packages. Although the testing discussed is for the new damped accelerometer in a LCC package, the damped sensor is also available in the traditional bolt-mount package as the legacy undamped accelerometer. Figure 2 compares the relative size of the LCC package to the traditional bolt-mount package.
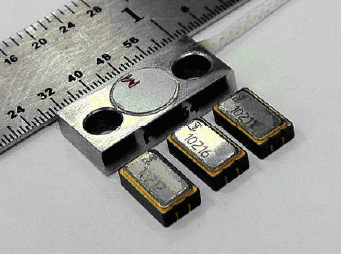 Figure 2. Relative size of the legacy undamped (bolt-on package) vs. the new damped (LCC package) accelerometers |
The following tests and results will be discussed:
- Hopkinson bar shock test results
- Linearity in the rated range
- Survivability to four times full range
- Zero shift after shock
- Damping
- Mechanical stops
- Frequency response
- Test fixture for laboratory testing
- VHG (Very High G) shock testing
- Test data for first production units
Test Methods
Meggitt Sensing Systems' in-house processes for the testing and evaluation of its high-g shock products are proprietary, and thus fall outside of the general scope of this article. In general industry terms, accelerometer qualification and performance testing procedures are proprietary to each manufacturer. Common testing methods include the Hopkinson bar, which is typically used to show performance characteristics to a sensor's F.S. operating performance range while also providing shock survivability and zero-shift data to illustrate accelerometer ruggedness. Various performance tests at F.S. range may also be conducted to verify resonance frequency and temperature performance specifications.
The main idea behind the Hopkinson bar is that a stress wave propagating through a long, slender elastic bar can be used to apply a dynamic load to a unit-under-test (UUT) located at the end of the bar. One method of determining the acceleration that the UUT undergoes (employed at Meggitt Sensing Systems) is by using strain gauges to measure the diametrical expansion (or contraction) at the mid-point of the bar to calculate the velocity, and therefore the acceleration, at the end of the bar. An alternate method uses a Laser Doppler Vibrometer (LDV) to directly measure the velocity at the end of the bar near the UUT, which can then be differentiated to calculate acceleration. The LDV is considered a primary standard. Another method used to evaluate accelerometer data is side-by-side testing, where a reference accelerometer (such as the industry standard undamped accelerometer) is placed alongside the unit-under-test allowing the acceleration outputs to be compared directly.
Both the LDV and side-by side methods were used in a series of tests performed at Eglin AFB, where the new damped high-shock accelerometer was tested on a titanium Hopkinson bar using flyaway technology (Figure 3). Because the stress wave will reflect back and forth within the Hopkinson bar, the flyaway is used to ensure that the UUT is subjected only to a single positive-going shock pulse. Figure 4 shows the mounting configurations for both the LDV (Figure 4A) and side-by-side referenced tests (Figure 4B). The reflective tape locations seen in Figure 4A identify the various focal points of the LDV used throughout the test series. Figures 5 through 7 confirm the validity of the data obtained at the Eglin AFB test facility.
|
|
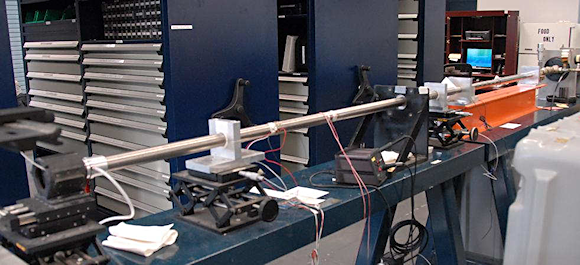
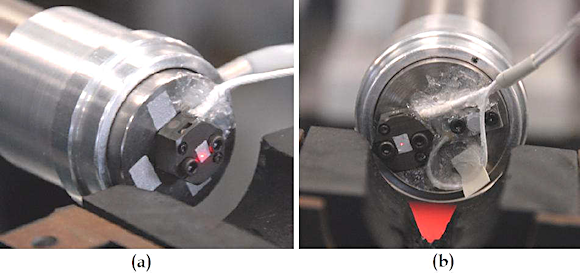 Figure 4. Mounting configurations for the LDV (A) and side-by-side reference methods (B) used in the test series (the legacy undamped reference accelerometer is partially obscured by RTV which is used to strain relieve the cable and prevent damage during shock) |
Figures 5 and 6 show repeatability over multiple tests conducted at the same acceleration level. The plots also show good correlation between the test accelerometer and the LDV, which validates the differentiation technique used on the velocity time history obtained using the LDV. A slight time delay, or phase shift, is also apparent in these plots, which is to be expected from a damped accelerometer.
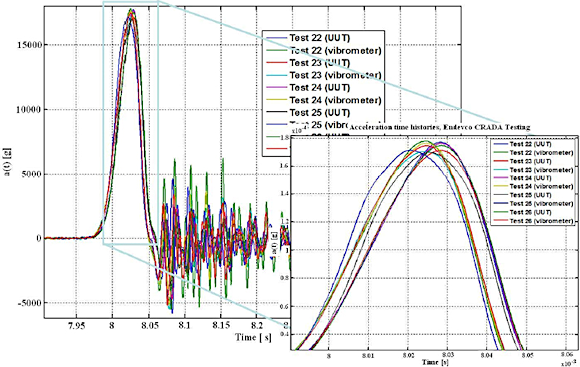 Figure 5. Time histories of multiple tests conducted at repeated full range accelerations compared to differentiated reference LDV data |
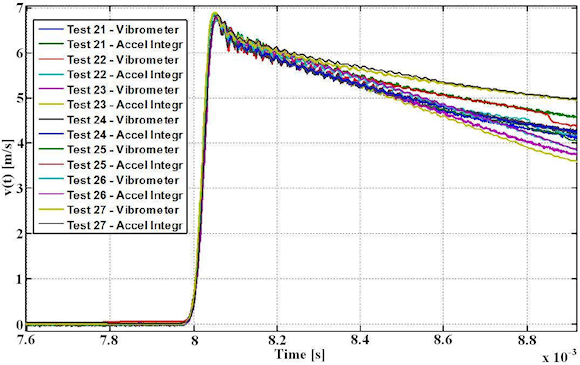 Figure 6. Integrated accelerometer time history versus LDV velocity data taken over seven consecutive 20,000 g shocks |
The integrated acceleration time history of the test accelerometer compared to the raw velocity output of the LDV shown in Figure 6 is for the same test series shown in Figure 5. The tight overlay of data in Figure 4 demonstrates the absence of DC offsets (relating to the accelerometer or slew rate) or aliasing of the data.
The coherence plot in Figure 7 provides a measure of the linearity of the system and a check to make sure all the inputs have been accounted for. More specifically, assuming a linear system, the coherence plot is a measure of how much of the energy on the output of the accelerometer can be attributed to the assumed input, as measured by the LDV. For example, a coherence of 0.9 means that 90% of the total energy of the output signal can be attributed to the input signal and therefore the remaining 10% was caused by some other input to the system that has not been accounted for, whether it is from electrical noise or additional mechanical inputs. The coherence plot was generated by averaging multiple data sets and is an excellent indication of a linear system and quality data to 90 kHz. The dips, or loss in coherence, near 68 kHz and 80 kHz have been shown to be minor resonant modes in the flyaway fixture.
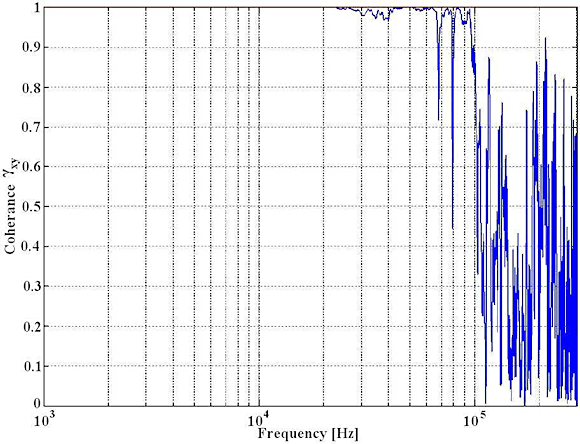 Figure 7. Accelerometer-to-LDV coherence averaged over multiple data sets |
Hopkinson Bar Shock Test Results
The four graphs in Figure 8 are from October 2010 Hopkinson bar testing performed at Eglin AFB. The approximate g levels were at 0.5X full range (10,000 g), full range (20,000 g), 1.5X full range (30,000 g) and 2X full range (40,000 g).
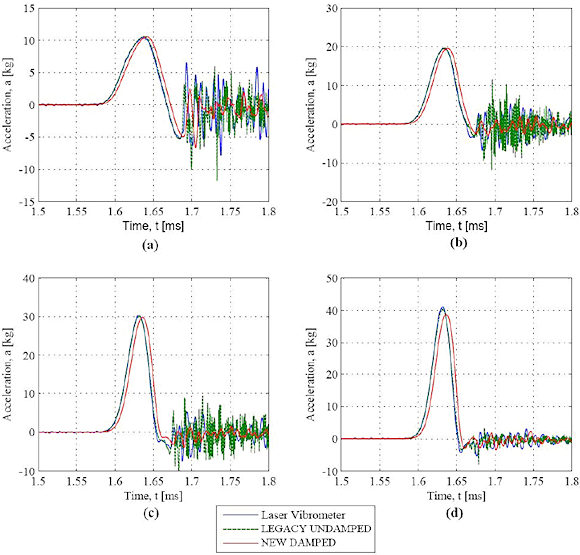 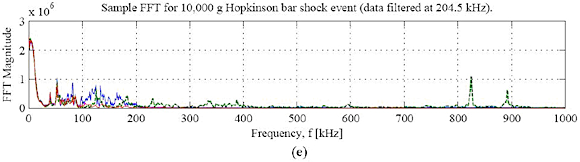 Figure 8. Hopkinson bar time history data near (a) 10,000 g, (b) 20,000 g, (c) 30,000 g, and (d) 40,000 g, along with a sample FFT (e) from the plot of Figure 8A |
The graphs show good agreement between the new damped high-shock unit under test (UUT) and the two standards—the legacy undamped accelerometer and the LDV—in amplitude, but the phase shift of the damped unit is readily apparent and relatively independent of g level. The amplitude of the damped accelerometer is slightly lower on the 10,000 g and 20,000 g plots than that of the standards, but a post-processing dynamic calibration could have corrected this calibration error, i.e., the sensitivity of the damped accelerometer entered into the graphical representation was a few percent too high. On the 30,000 g plot, the amplitude of the damped unit is significantly lower than the two standards, and further decreases as 40,000 g is attained. This gradual decrease in output for the new damped unit is due to the location of the accelerometer's mechanical stops (between 2X and 3X full range) and the squeeze-film damping. The FFT plots at all g levels show the characteristic double-peak resonance of the legacy undamped accelerometer. As expected, the new damped accelerometer (with a resonance of approximately 100 kHz) has a negligible response to the higher frequencies.
Linearity in the Rated Range
The data shown in Figure 9 was obtained on the Hopkinson bar at Eglin AFB, using the LDV as the standard. The experimental data were regression-fitted to a straight line in the 20,000 g range; note the multiple readings taken at approximately F.S. Although the squeeze-film damping and mechanical stops used by the new sensor roll off the sensitivity at higher acceleration levels, the damped high-shock accelerometer has excellent linearity to at least 1.5X its rated range, as Figure 9 demonstrates.
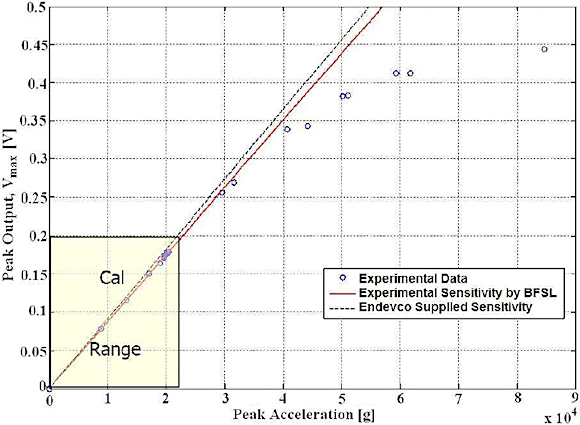 Figure 9. Linearity plot for the new damped 20,000 g accelerometer at shocks up to 84,000 g |
Survivability
Two different damped 20,000 g high-shock accelerometers experienced a total of 50 high-g shocks ranging from 10,000 g to 84,000 g. A sampling of these shocks is shown in the linearity plot of Figure 9. The worst case zero shift observed was 150 µV at 5.0 VDC excitation. During the entire test series, there were no out-of-specification readings from the two prototype units. Previous Hopkinson bar testing at Meggitt Sensing Systems, San Juan Capistrano, demonstrated survivability up to 240,000 g in both sensitive and cross axes.
Part 2 of this article will discuss further characterization of the accelerometer, describe a novel test fixture used for SMT accelerometers, and provide results from Very High G shock testing performed on the device.
ABOUT THE AUTHORS
Randy Martin is the Director of Mechanical Engineering, for Meggitt Sensing Systems North America and can be reached at 949-493-8181, [email protected].
James Letterneau is a Transducer Design Engineer for Meggitt Sensing Systems in San Juan Capistrano, CA, and can be reached at [email protected].
Tom Kwa is the MEMS Design and Development Manager for Meggitt Sensing Systems in Sunnyvale, CA and can be reached at [email protected].